Native/Alaskan vs Assyrian/Chaldean/Syriac Unemployment Among Ages 30 to 34 years
COMPARE
Native/Alaskan
Assyrian/Chaldean/Syriac
Unemployment Among Ages 30 to 34 years
Unemployment Among Ages 30 to 34 years Comparison
Natives/Alaskans
Assyrians/Chaldeans/Syriacs
8.2%
UNEMPLOYMENT AMONG AGES 30 TO 34 YEARS
0.0/ 100
METRIC RATING
332nd/ 347
METRIC RANK
5.1%
UNEMPLOYMENT AMONG AGES 30 TO 34 YEARS
98.4/ 100
METRIC RATING
48th/ 347
METRIC RANK
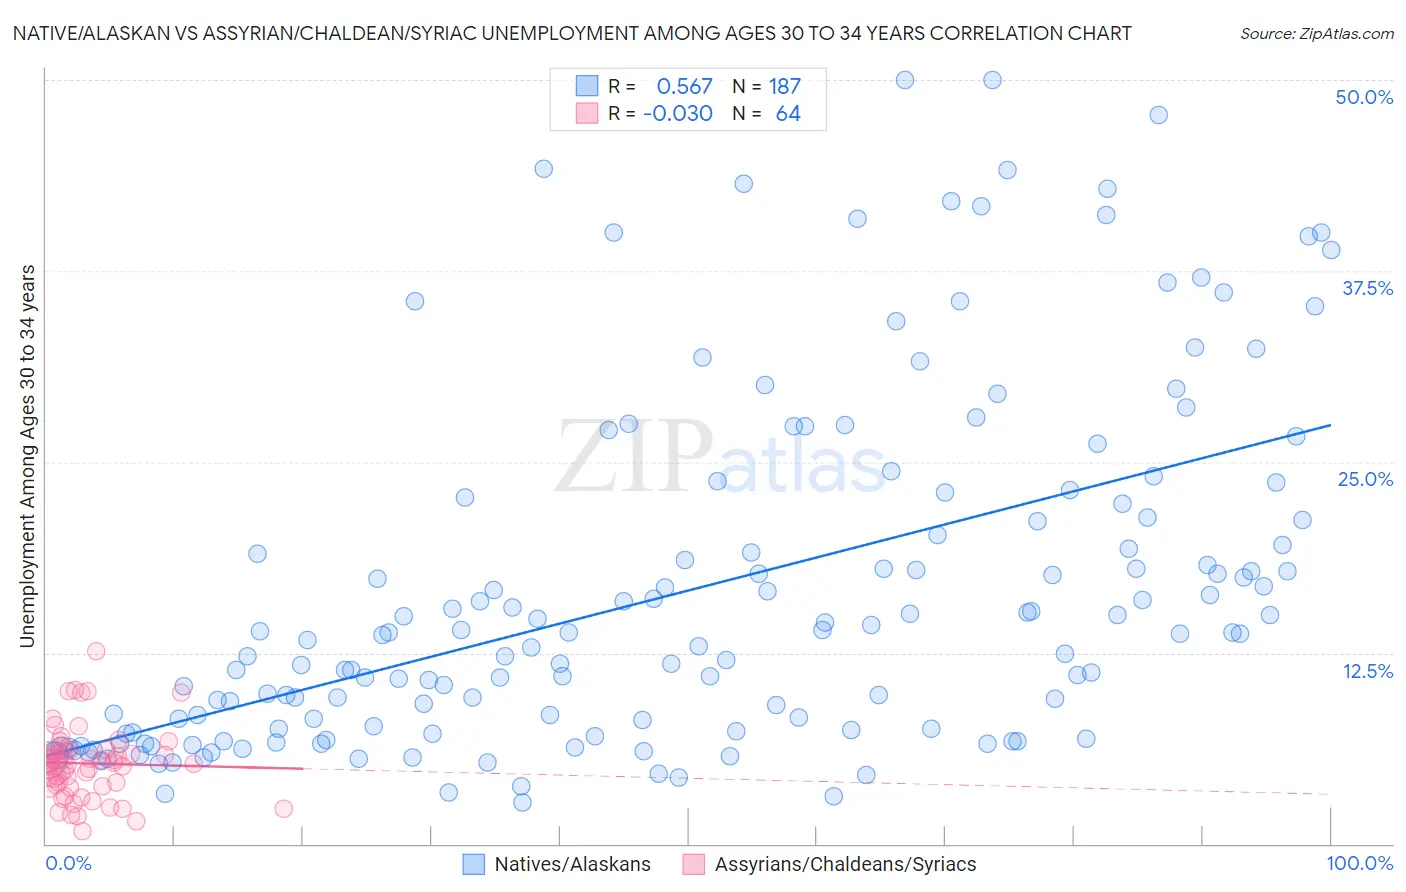
Native/Alaskan vs Assyrian/Chaldean/Syriac Unemployment Among Ages 30 to 34 years Correlation Chart
The statistical analysis conducted on geographies consisting of 466,883,769 people shows a substantial positive correlation between the proportion of Natives/Alaskans and unemployment rate among population between the ages 30 and 34 in the United States with a correlation coefficient (R) of 0.567 and weighted average of 8.2%. Similarly, the statistical analysis conducted on geographies consisting of 108,429,233 people shows no correlation between the proportion of Assyrians/Chaldeans/Syriacs and unemployment rate among population between the ages 30 and 34 in the United States with a correlation coefficient (R) of -0.030 and weighted average of 5.1%, a difference of 62.4%.
Unemployment Among Ages 30 to 34 years Correlation Summary
| Measurement | Native/Alaskan | Assyrian/Chaldean/Syriac |
| Minimum | 2.7% | 0.80% |
| Maximum | 50.0% | 12.6% |
| Range | 47.3% | 11.8% |
| Mean | 16.5% | 5.3% |
| Median | 13.7% | 5.2% |
| Interquartile 25% (IQ1) | 7.4% | 3.8% |
| Interquartile 75% (IQ3) | 21.4% | 6.1% |
| Interquartile Range (IQR) | 14.0% | 2.3% |
| Standard Deviation (Sample) | 11.3% | 2.3% |
| Standard Deviation (Population) | 11.3% | 2.3% |
Similar Demographics by Unemployment Among Ages 30 to 34 years
Demographics Similar to Natives/Alaskans by Unemployment Among Ages 30 to 34 years
In terms of unemployment among ages 30 to 34 years, the demographic groups most similar to Natives/Alaskans are Pueblo (8.3%, a difference of 0.43%), Sioux (8.0%, a difference of 2.6%), Alaska Native (8.5%, a difference of 3.1%), Shoshone (7.9%, a difference of 4.1%), and Cheyenne (7.8%, a difference of 5.1%).
| Demographics | Rating | Rank | Unemployment Among Ages 30 to 34 years |
| Apache | 0.0 /100 | #325 | Tragic 7.3% |
| Dominicans | 0.0 /100 | #326 | Tragic 7.7% |
| Immigrants | Dominican Republic | 0.0 /100 | #327 | Tragic 7.7% |
| Chippewa | 0.0 /100 | #328 | Tragic 7.8% |
| Cheyenne | 0.0 /100 | #329 | Tragic 7.8% |
| Shoshone | 0.0 /100 | #330 | Tragic 7.9% |
| Sioux | 0.0 /100 | #331 | Tragic 8.0% |
| Natives/Alaskans | 0.0 /100 | #332 | Tragic 8.2% |
| Pueblo | 0.0 /100 | #333 | Tragic 8.3% |
| Alaska Natives | 0.0 /100 | #334 | Tragic 8.5% |
| Puerto Ricans | 0.0 /100 | #335 | Tragic 8.9% |
| Colville | 0.0 /100 | #336 | Tragic 9.0% |
| Pima | 0.0 /100 | #337 | Tragic 9.6% |
| Yakama | 0.0 /100 | #338 | Tragic 9.8% |
| Tohono O'odham | 0.0 /100 | #339 | Tragic 9.8% |
Demographics Similar to Assyrians/Chaldeans/Syriacs by Unemployment Among Ages 30 to 34 years
In terms of unemployment among ages 30 to 34 years, the demographic groups most similar to Assyrians/Chaldeans/Syriacs are Cypriot (5.1%, a difference of 0.020%), Immigrants from Congo (5.1%, a difference of 0.040%), Immigrants from Malaysia (5.1%, a difference of 0.12%), Puget Sound Salish (5.1%, a difference of 0.20%), and Turkish (5.1%, a difference of 0.23%).
| Demographics | Rating | Rank | Unemployment Among Ages 30 to 34 years |
| Immigrants | Eastern Africa | 98.9 /100 | #41 | Exceptional 5.0% |
| Immigrants | Hong Kong | 98.8 /100 | #42 | Exceptional 5.0% |
| Soviet Union | 98.8 /100 | #43 | Exceptional 5.0% |
| Immigrants | Belgium | 98.7 /100 | #44 | Exceptional 5.1% |
| Yugoslavians | 98.6 /100 | #45 | Exceptional 5.1% |
| Immigrants | Congo | 98.4 /100 | #46 | Exceptional 5.1% |
| Cypriots | 98.4 /100 | #47 | Exceptional 5.1% |
| Assyrians/Chaldeans/Syriacs | 98.4 /100 | #48 | Exceptional 5.1% |
| Immigrants | Malaysia | 98.3 /100 | #49 | Exceptional 5.1% |
| Puget Sound Salish | 98.2 /100 | #50 | Exceptional 5.1% |
| Turks | 98.2 /100 | #51 | Exceptional 5.1% |
| Immigrants | Burma/Myanmar | 98.1 /100 | #52 | Exceptional 5.1% |
| Cubans | 98.1 /100 | #53 | Exceptional 5.1% |
| Immigrants | Morocco | 97.9 /100 | #54 | Exceptional 5.1% |
| Chinese | 97.7 /100 | #55 | Exceptional 5.1% |