Immigrants from France vs Immigrants from Caribbean Average Family Size
COMPARE
Immigrants from France
Immigrants from Caribbean
Average Family Size
Average Family Size Comparison
Immigrants from France
Immigrants from Caribbean
3.15
AVERAGE FAMILY SIZE
0.4/ 100
METRIC RATING
284th/ 347
METRIC RANK
3.33
AVERAGE FAMILY SIZE
99.9/ 100
METRIC RATING
72nd/ 347
METRIC RANK
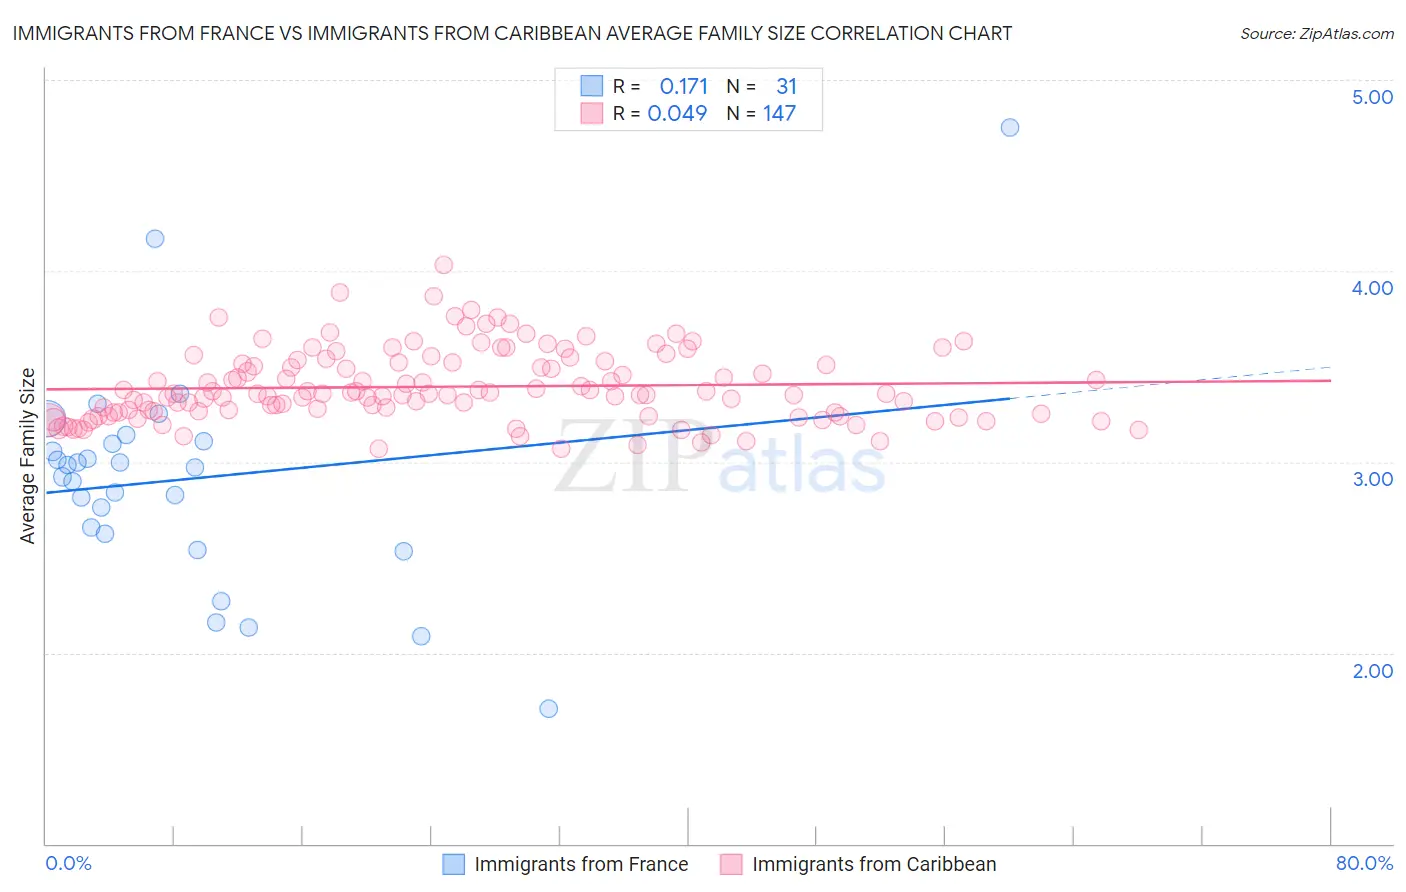
Immigrants from France vs Immigrants from Caribbean Average Family Size Correlation Chart
The statistical analysis conducted on geographies consisting of 287,855,925 people shows a poor positive correlation between the proportion of Immigrants from France and average family size in the United States with a correlation coefficient (R) of 0.171 and weighted average of 3.15. Similarly, the statistical analysis conducted on geographies consisting of 449,692,212 people shows no correlation between the proportion of Immigrants from Caribbean and average family size in the United States with a correlation coefficient (R) of 0.049 and weighted average of 3.33, a difference of 5.7%.
Average Family Size Correlation Summary
| Measurement | Immigrants from France | Immigrants from Caribbean |
| Minimum | 1.71 | 3.07 |
| Maximum | 4.75 | 4.03 |
| Range | 3.04 | 0.96 |
| Mean | 2.91 | 3.39 |
| Median | 2.97 | 3.36 |
| Interquartile 25% (IQ1) | 2.63 | 3.26 |
| Interquartile 75% (IQ3) | 3.11 | 3.52 |
| Interquartile Range (IQR) | 0.48 | 0.27 |
| Standard Deviation (Sample) | 0.57 | 0.19 |
| Standard Deviation (Population) | 0.57 | 0.19 |
Similar Demographics by Average Family Size
Demographics Similar to Immigrants from France by Average Family Size
In terms of average family size, the demographic groups most similar to Immigrants from France are German Russian (3.15, a difference of 0.020%), Yugoslavian (3.15, a difference of 0.030%), Immigrants from Denmark (3.15, a difference of 0.040%), White/Caucasian (3.14, a difference of 0.050%), and Immigrants from England (3.15, a difference of 0.070%).
| Demographics | Rating | Rank | Average Family Size |
| Swiss | 0.5 /100 | #277 | Tragic 3.15 |
| Okinawans | 0.5 /100 | #278 | Tragic 3.15 |
| Immigrants | Europe | 0.5 /100 | #279 | Tragic 3.15 |
| Immigrants | England | 0.4 /100 | #280 | Tragic 3.15 |
| Immigrants | Denmark | 0.4 /100 | #281 | Tragic 3.15 |
| Yugoslavians | 0.4 /100 | #282 | Tragic 3.15 |
| German Russians | 0.4 /100 | #283 | Tragic 3.15 |
| Immigrants | France | 0.4 /100 | #284 | Tragic 3.15 |
| Whites/Caucasians | 0.3 /100 | #285 | Tragic 3.14 |
| Immigrants | Netherlands | 0.3 /100 | #286 | Tragic 3.14 |
| Greeks | 0.3 /100 | #287 | Tragic 3.14 |
| Immigrants | Czechoslovakia | 0.3 /100 | #288 | Tragic 3.14 |
| Immigrants | Norway | 0.3 /100 | #289 | Tragic 3.14 |
| Cypriots | 0.3 /100 | #290 | Tragic 3.14 |
| Alsatians | 0.2 /100 | #291 | Tragic 3.14 |
Demographics Similar to Immigrants from Caribbean by Average Family Size
In terms of average family size, the demographic groups most similar to Immigrants from Caribbean are Yaqui (3.32, a difference of 0.030%), Immigrants from Sierra Leone (3.32, a difference of 0.050%), Immigrants from West Indies (3.33, a difference of 0.070%), Immigrants from Trinidad and Tobago (3.33, a difference of 0.080%), and Immigrants from Barbados (3.32, a difference of 0.090%).
| Demographics | Rating | Rank | Average Family Size |
| Immigrants | Laos | 99.9 /100 | #65 | Exceptional 3.34 |
| Immigrants | St. Vincent and the Grenadines | 99.9 /100 | #66 | Exceptional 3.34 |
| Immigrants | Jamaica | 99.9 /100 | #67 | Exceptional 3.33 |
| Immigrants | Cambodia | 99.9 /100 | #68 | Exceptional 3.33 |
| Immigrants | Immigrants | 99.9 /100 | #69 | Exceptional 3.33 |
| Immigrants | Trinidad and Tobago | 99.9 /100 | #70 | Exceptional 3.33 |
| Immigrants | West Indies | 99.9 /100 | #71 | Exceptional 3.33 |
| Immigrants | Caribbean | 99.9 /100 | #72 | Exceptional 3.33 |
| Yaqui | 99.9 /100 | #73 | Exceptional 3.32 |
| Immigrants | Sierra Leone | 99.9 /100 | #74 | Exceptional 3.32 |
| Immigrants | Barbados | 99.8 /100 | #75 | Exceptional 3.32 |
| Trinidadians and Tobagonians | 99.8 /100 | #76 | Exceptional 3.32 |
| Immigrants | Ecuador | 99.8 /100 | #77 | Exceptional 3.32 |
| Immigrants | Micronesia | 99.8 /100 | #78 | Exceptional 3.32 |
| British West Indians | 99.8 /100 | #79 | Exceptional 3.32 |