Immigrants from South Africa vs Immigrants from Caribbean Average Family Size

COMPARE

Immigrants from South Africa
Race
Ancestry
AfghanAfricanAlaska NativeAlaskan AthabascanAlbanianAleutAlsatianAmericanApacheArabArapahoArgentineanArmenianAssyrian/Chaldean/SyriacAustralianAustrianBahamianBangladeshiBarbadianBasqueBelgianBelizeanBermudanBhutaneseBlackfeetBolivianBrazilianBritishBritish West IndianBulgarianBurmeseCajunCambodianCanadianCape VerdeanCarpatho RusynCelticCentral AmericanCentral American IndianCherokeeCheyenneChickasawChileanChineseChippewaChoctawColombianColvilleComancheCosta RicanCreeCreekCroatianCrowCubanCypriotCzechCzechoslovakianDanishDelawareDominicanDutchDutch West IndianEastern EuropeanEcuadorianEgyptianEnglishEstonianEthiopianEuropeanFijianFilipinoFinnishFrenchFrench American IndianFrench CanadianGermanGerman RussianGhanaianGreekGuamanian/ChamorroGuatemalanGuyaneseHaitianHmongHonduranHopiHoumaHungarianIcelanderIndian (Asian)IndonesianInupiatIranianIraqiIrishIroquoisIsraeliItalianJamaicanJapaneseJordanianKenyanKiowaKoreanLaotianLatvianLebaneseLiberianLithuanianLumbeeLuxembourgerMacedonianMalaysianMalteseMarshalleseMenomineeMexicanMexican American IndianMongolianMoroccanNative HawaiianNavajoNepaleseNew ZealanderNicaraguanNigerianNorthern EuropeanNorwegianOkinawanOsageOttawaPaiutePakistaniPalestinianPanamanianParaguayanPennsylvania GermanPeruvianPimaPolishPortuguesePotawatomiPuebloPuerto RicanPuget Sound SalishRomanianRussianSalvadoranSamoanScandinavianScotch-IrishScottishSeminoleSenegaleseSerbianShoshoneSierra LeoneanSiouxSlavicSlovakSloveneSomaliSouth AfricanSouth AmericanSouth American IndianSoviet UnionSpaniardSpanishSpanish AmericanSpanish American IndianSri LankanSubsaharan AfricanSudaneseSwedishSwissSyrianTaiwaneseThaiTlingit-HaidaTohono O'OdhamTonganTrinidadian and TobagonianTsimshianTurkishU.S. Virgin IslanderUgandanUkrainianUruguayanUteVenezuelanVietnameseWelshWest IndianYakamaYaquiYugoslavianYumanYup'ikZimbabwean
Immigration
NonimmigrantsImmigrantsAfghanistanAfricaAlbaniaArgentinaArmeniaAsiaAustraliaAustriaBahamasBangladeshBarbadosBelarusBelgiumBelizeBoliviaBosnia and HerzegovinaBrazilBulgariaBurma/MyanmarCabo VerdeCambodiaCameroonCanadaCentral AmericaChileChinaColombiaCongoCosta RicaCroatiaCubaCzechoslovakiaDenmarkDominicaDominican RepublicEastern AfricaEastern AsiaEastern EuropeEcuadorEgyptEl SalvadorEnglandEritreaEthiopiaEuropeFijiFranceGermanyGhanaGreeceGrenadaGuatemalaGuyanaHaitiHondurasHong KongHungaryIndiaIndonesiaIranIraqIrelandIsraelItalyJamaicaJapanJordanKazakhstanKenyaKoreaKuwaitLaosLatin AmericaLatviaLebanonLiberiaLithuaniaMalaysiaMexicoMicronesiaMiddle AfricaMoldovaMoroccoNepalNetherlandsNicaraguaNigeriaNorth AmericaNorth MacedoniaNorthern AfricaNorthern EuropeNorwayOceaniaPakistanPanamaPeruPhilippinesPolandPortugalRomaniaRussiaSaudi ArabiaScotlandSenegalSerbiaSierra LeoneSingaporeSomaliaSouth AfricaSouth AmericaSouth Central AsiaSouth Eastern AsiaSouthern EuropeSpainSri LankaSt. Vincent and the GrenadinesSudanSwedenSwitzerlandSyriaTaiwanThailandTrinidad and TobagoTurkeyUgandaUkraineUruguayUzbekistanVenezuelaVietnamWest IndiesWestern AfricaWestern AsiaWestern EuropeYemenZaireZimbabweAzores
Immigrants from Caribbean
Race
Ancestry
AfghanAfricanAlaska NativeAlaskan AthabascanAlbanianAleutAlsatianAmericanApacheArabArapahoArgentineanArmenianAssyrian/Chaldean/SyriacAustralianAustrianBahamianBangladeshiBarbadianBasqueBelgianBelizeanBermudanBhutaneseBlackfeetBolivianBrazilianBritishBritish West IndianBulgarianBurmeseCajunCambodianCanadianCape VerdeanCarpatho RusynCelticCentral AmericanCentral American IndianCherokeeCheyenneChickasawChileanChineseChippewaChoctawColombianColvilleComancheCosta RicanCreeCreekCroatianCrowCubanCypriotCzechCzechoslovakianDanishDelawareDominicanDutchDutch West IndianEastern EuropeanEcuadorianEgyptianEnglishEstonianEthiopianEuropeanFijianFilipinoFinnishFrenchFrench American IndianFrench CanadianGermanGerman RussianGhanaianGreekGuamanian/ChamorroGuatemalanGuyaneseHaitianHmongHonduranHopiHoumaHungarianIcelanderIndian (Asian)IndonesianInupiatIranianIraqiIrishIroquoisIsraeliItalianJamaicanJapaneseJordanianKenyanKiowaKoreanLaotianLatvianLebaneseLiberianLithuanianLumbeeLuxembourgerMacedonianMalaysianMalteseMarshalleseMenomineeMexicanMexican American IndianMongolianMoroccanNative HawaiianNavajoNepaleseNew ZealanderNicaraguanNigerianNorthern EuropeanNorwegianOkinawanOsageOttawaPaiutePakistaniPalestinianPanamanianParaguayanPennsylvania GermanPeruvianPimaPolishPortuguesePotawatomiPuebloPuerto RicanPuget Sound SalishRomanianRussianSalvadoranSamoanScandinavianScotch-IrishScottishSeminoleSenegaleseSerbianShoshoneSierra LeoneanSiouxSlavicSlovakSloveneSomaliSouth AfricanSouth AmericanSouth American IndianSoviet UnionSpaniardSpanishSpanish AmericanSpanish American IndianSri LankanSubsaharan AfricanSudaneseSwedishSwissSyrianTaiwaneseThaiTlingit-HaidaTohono O'OdhamTonganTrinidadian and TobagonianTsimshianTurkishU.S. Virgin IslanderUgandanUkrainianUruguayanUteVenezuelanVietnameseWelshWest IndianYakamaYaquiYugoslavianYumanYup'ikZimbabwean
Immigration
NonimmigrantsImmigrantsAfghanistanAfricaAlbaniaArgentinaArmeniaAsiaAustraliaAustriaBahamasBangladeshBarbadosBelarusBelgiumBelizeBoliviaBosnia and HerzegovinaBrazilBulgariaBurma/MyanmarCabo VerdeCambodiaCameroonCanadaCaribbeanCentral AmericaChileChinaColombiaCongoCosta RicaCroatiaCubaCzechoslovakiaDenmarkDominicaDominican RepublicEastern AfricaEastern AsiaEastern EuropeEcuadorEgyptEl SalvadorEnglandEritreaEthiopiaEuropeFijiFranceGermanyGhanaGreeceGrenadaGuatemalaGuyanaHaitiHondurasHong KongHungaryIndiaIndonesiaIranIraqIrelandIsraelItalyJamaicaJapanJordanKazakhstanKenyaKoreaKuwaitLaosLatin AmericaLatviaLebanonLiberiaLithuaniaMalaysiaMexicoMicronesiaMiddle AfricaMoldovaMoroccoNepalNetherlandsNicaraguaNigeriaNorth AmericaNorth MacedoniaNorthern AfricaNorthern EuropeNorwayOceaniaPakistanPanamaPeruPhilippinesPolandPortugalRomaniaRussiaSaudi ArabiaScotlandSenegalSerbiaSierra LeoneSingaporeSomaliaSouth AmericaSouth Central AsiaSouth Eastern AsiaSouthern EuropeSpainSri LankaSt. Vincent and the GrenadinesSudanSwedenSwitzerlandSyriaTaiwanThailandTrinidad and TobagoTurkeyUgandaUkraineUruguayUzbekistanVenezuelaVietnamWest IndiesWestern AfricaWestern AsiaWestern EuropeYemenZaireZimbabweAzores
Average Family Size
Income
Poverty
Unemployment
Labor Participation
Family Structure
Vehicle Availability
Education Level
Disability

Average Family Size Comparison

Immigrants from South Africa

Immigrants from Caribbean

Tragic
Exceptional
3.16
AVERAGE FAMILY SIZE
0.9/ 100
METRIC RATING
265th/ 347
METRIC RANK
3.33
AVERAGE FAMILY SIZE
99.9/ 100
METRIC RATING
72nd/ 347
METRIC RANK

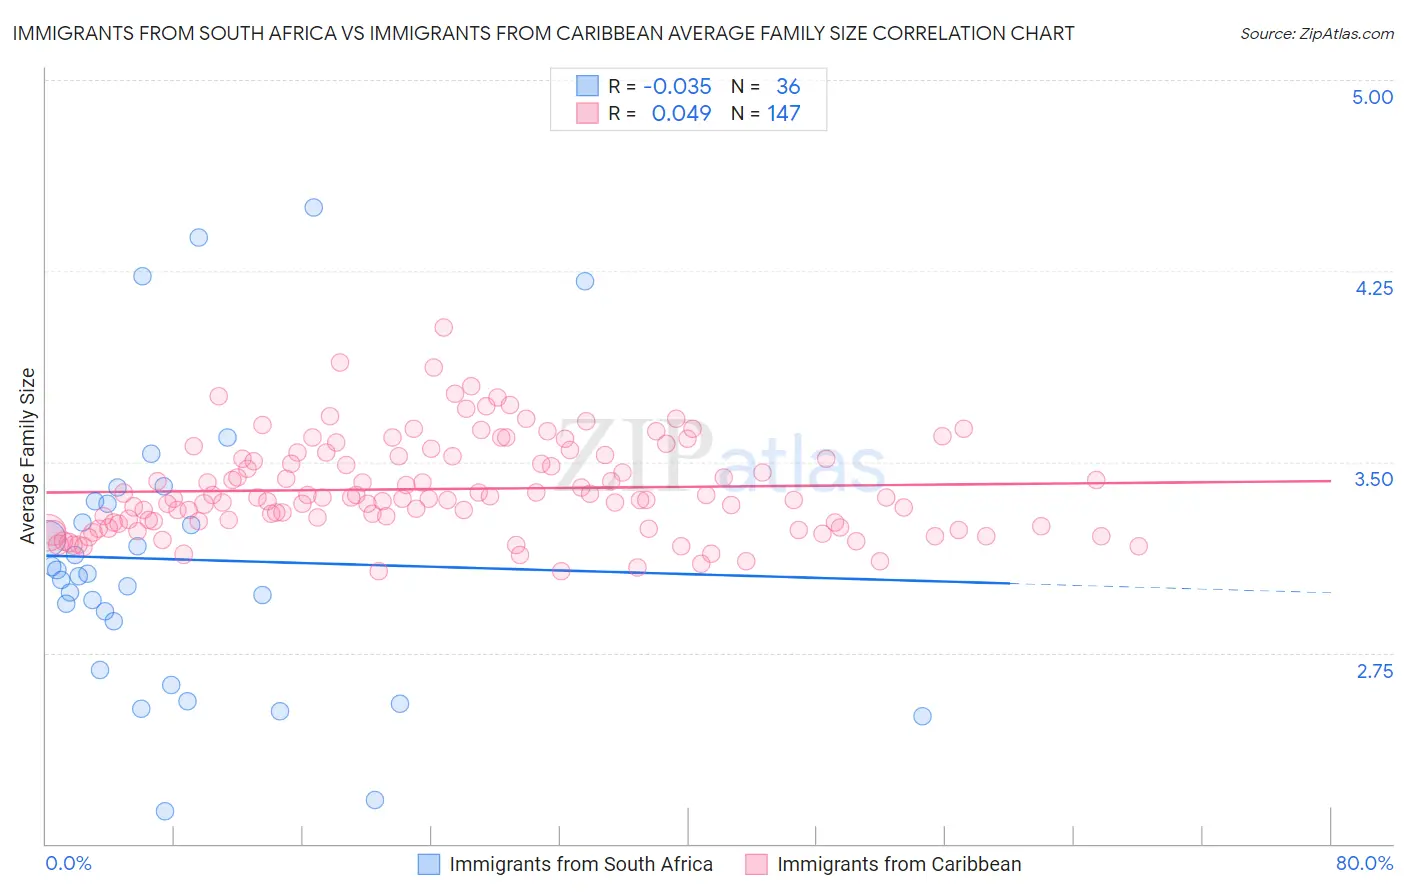
Immigrants from South Africa vs Immigrants from Caribbean Average Family Size Correlation Chart

The statistical analysis conducted on geographies consisting of 233,270,414 people shows no correlation between the proportion of Immigrants from South Africa and average family size in the United States with a correlation coefficient (R) of -0.035 and weighted average of 3.16. Similarly, the statistical analysis conducted on geographies consisting of 449,692,212 people shows no correlation between the proportion of Immigrants from Caribbean and average family size in the United States with a correlation coefficient (R) of 0.049 and weighted average of 3.33, a difference of 5.3%.
Immigrants from South Africa vs Immigrants from Caribbean Average Family Size

Average Family Size Correlation Summary

MeasurementImmigrants from South AfricaImmigrants from Caribbean
Minimum2.133.07
Maximum4.504.03
Range2.370.96
Mean3.123.39
Median3.063.36
Interquartile 25% (IQ1)2.783.26
Interquartile 75% (IQ3)3.343.52
Interquartile Range (IQR)0.560.27
Standard Deviation (Sample)0.560.19
Standard Deviation (Population)0.550.19

Similar Demographics by Average Family Size

Demographics Similar to Immigrants from South Africa by Average Family Size

In terms of average family size, the demographic groups most similar to Immigrants from South Africa are Immigrants from Greece (3.16, a difference of 0.010%), Iroquois (3.16, a difference of 0.030%), American (3.16, a difference of 0.050%), Immigrants from Bulgaria (3.16, a difference of 0.070%), and Maltese (3.16, a difference of 0.080%).
DemographicsRating | RankAverage Family Size
Turks
1.3
/100
|
#258
Tragic
3.16
Potawatomi
1.3
/100
|
#259
Tragic
3.16
Immigrants | Albania
1.3
/100
|
#260
Tragic
3.16
Immigrants | North Macedonia
1.3
/100
|
#261
Tragic
3.16
Immigrants | Russia
1.3
/100
|
#262
Tragic
3.16
Immigrants | Bulgaria
1.0
/100
|
#263
Tragic
3.16
Americans
1.0
/100
|
#264
Tragic
3.16
Immigrants | South Africa
0.9
/100
|
#265
Tragic
3.16
Immigrants | Greece
0.9
/100
|
#266
Tragic
3.16
Iroquois
0.8
/100
|
#267
Tragic
3.16
Maltese
0.8
/100
|
#268
Tragic
3.16
Immigrants | Singapore
0.7
/100
|
#269
Tragic
3.16
Tlingit-Haida
0.7
/100
|
#270
Tragic
3.16
Immigrants | Germany
0.7
/100
|
#271
Tragic
3.15
Immigrants | Lithuania
0.6
/100
|
#272
Tragic
3.15

Demographics Similar to Immigrants from Caribbean by Average Family Size

In terms of average family size, the demographic groups most similar to Immigrants from Caribbean are Yaqui (3.32, a difference of 0.030%), Immigrants from Sierra Leone (3.32, a difference of 0.050%), Immigrants from West Indies (3.33, a difference of 0.070%), Immigrants from Trinidad and Tobago (3.33, a difference of 0.080%), and Immigrants from Barbados (3.32, a difference of 0.090%).
DemographicsRating | RankAverage Family Size
Immigrants | Laos
99.9
/100
|
#65
Exceptional
3.34
Immigrants | St. Vincent and the Grenadines
99.9
/100
|
#66
Exceptional
3.34
Immigrants | Jamaica
99.9
/100
|
#67
Exceptional
3.33
Immigrants | Cambodia
99.9
/100
|
#68
Exceptional
3.33
Immigrants | Immigrants
99.9
/100
|
#69
Exceptional
3.33
Immigrants | Trinidad and Tobago
99.9
/100
|
#70
Exceptional
3.33
Immigrants | West Indies
99.9
/100
|
#71
Exceptional
3.33
Immigrants | Caribbean
99.9
/100
|
#72
Exceptional
3.33
Yaqui
99.9
/100
|
#73
Exceptional
3.32
Immigrants | Sierra Leone
99.9
/100
|
#74
Exceptional
3.32
Immigrants | Barbados
99.8
/100
|
#75
Exceptional
3.32
Trinidadians and Tobagonians
99.8
/100
|
#76
Exceptional
3.32
Immigrants | Ecuador
99.8
/100
|
#77
Exceptional
3.32
Immigrants | Micronesia
99.8
/100
|
#78
Exceptional
3.32
British West Indians
99.8
/100
|
#79
Exceptional
3.32