Menominee vs Immigrants from Ecuador Single Mother Households
COMPARE
Menominee
Immigrants from Ecuador
Single Mother Households
Single Mother Households Comparison
Menominee
Immigrants from Ecuador
9.2%
SINGLE MOTHER HOUSEHOLDS
0.0/ 100
METRIC RATING
342nd/ 347
METRIC RANK
7.3%
SINGLE MOTHER HOUSEHOLDS
0.3/ 100
METRIC RATING
254th/ 347
METRIC RANK
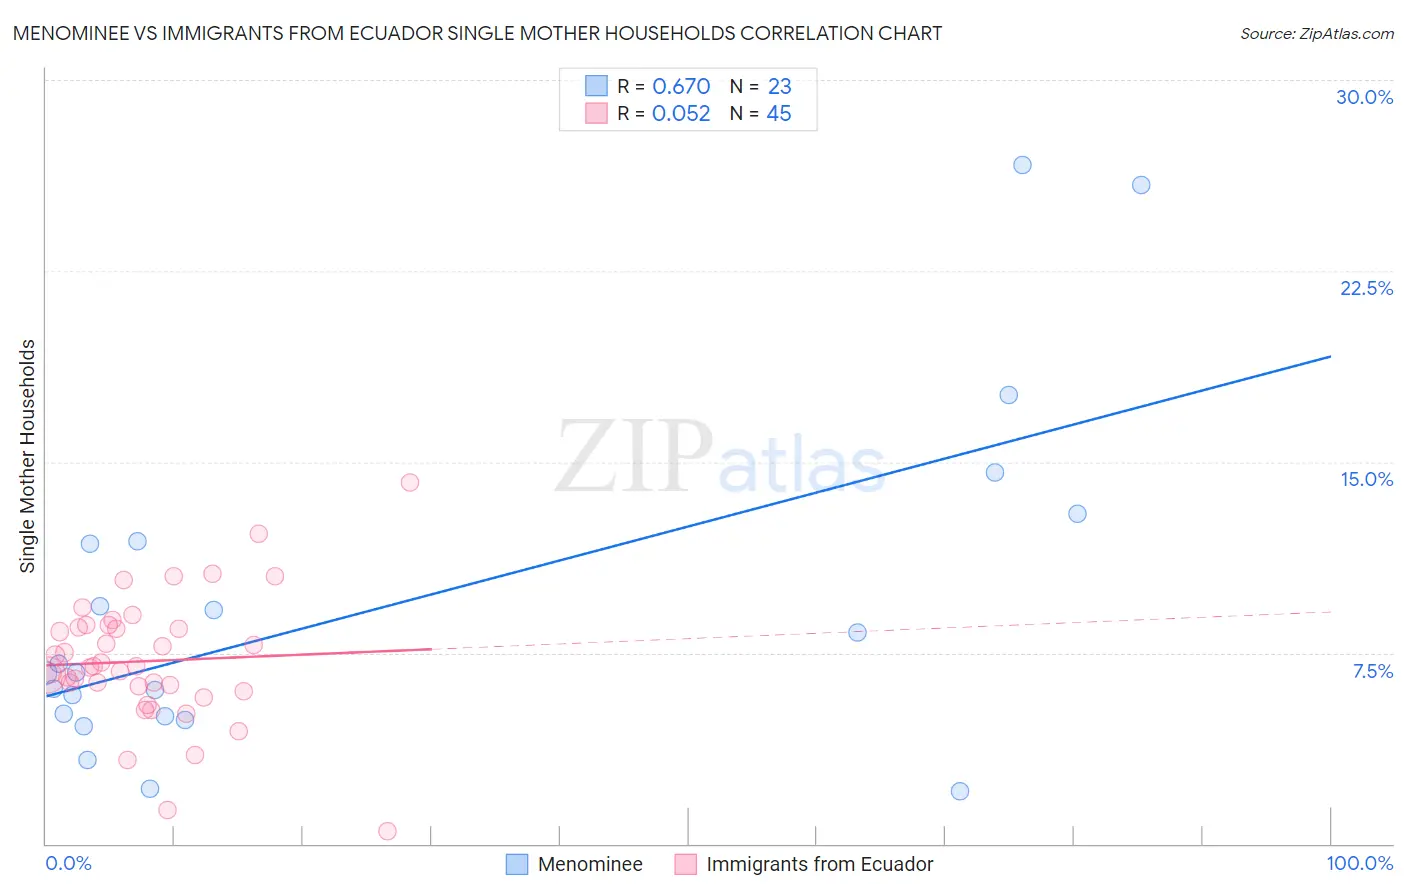
Menominee vs Immigrants from Ecuador Single Mother Households Correlation Chart
The statistical analysis conducted on geographies consisting of 45,774,127 people shows a significant positive correlation between the proportion of Menominee and percentage of single mother households in the United States with a correlation coefficient (R) of 0.670 and weighted average of 9.2%. Similarly, the statistical analysis conducted on geographies consisting of 270,615,585 people shows a slight positive correlation between the proportion of Immigrants from Ecuador and percentage of single mother households in the United States with a correlation coefficient (R) of 0.052 and weighted average of 7.3%, a difference of 24.8%.
Single Mother Households Correlation Summary
| Measurement | Menominee | Immigrants from Ecuador |
| Minimum | 2.0% | 0.47% |
| Maximum | 26.7% | 14.2% |
| Range | 24.6% | 13.7% |
| Mean | 9.3% | 7.2% |
| Median | 6.7% | 7.0% |
| Interquartile 25% (IQ1) | 5.0% | 6.1% |
| Interquartile 75% (IQ3) | 11.9% | 8.5% |
| Interquartile Range (IQR) | 6.9% | 2.5% |
| Standard Deviation (Sample) | 6.6% | 2.5% |
| Standard Deviation (Population) | 6.5% | 2.5% |
Similar Demographics by Single Mother Households
Demographics Similar to Menominee by Single Mother Households
In terms of single mother households, the demographic groups most similar to Menominee are Dominican (9.2%, a difference of 0.21%), Tohono O'odham (9.1%, a difference of 0.32%), Lumbee (9.1%, a difference of 0.68%), Black/African American (9.0%, a difference of 1.9%), and Cape Verdean (8.9%, a difference of 3.5%).
| Demographics | Rating | Rank | Single Mother Households |
| Liberians | 0.0 /100 | #333 | Tragic 8.6% |
| Immigrants | Liberia | 0.0 /100 | #334 | Tragic 8.7% |
| Immigrants | Dominica | 0.0 /100 | #335 | Tragic 8.7% |
| Puerto Ricans | 0.0 /100 | #336 | Tragic 8.7% |
| Navajo | 0.0 /100 | #337 | Tragic 8.8% |
| Cape Verdeans | 0.0 /100 | #338 | Tragic 8.9% |
| Blacks/African Americans | 0.0 /100 | #339 | Tragic 9.0% |
| Lumbee | 0.0 /100 | #340 | Tragic 9.1% |
| Tohono O'odham | 0.0 /100 | #341 | Tragic 9.1% |
| Menominee | 0.0 /100 | #342 | Tragic 9.2% |
| Dominicans | 0.0 /100 | #343 | Tragic 9.2% |
| Immigrants | Dominican Republic | 0.0 /100 | #344 | Tragic 9.5% |
| Immigrants | Cabo Verde | 0.0 /100 | #345 | Tragic 9.6% |
| Yuman | 0.0 /100 | #346 | Tragic 9.6% |
| Yup'ik | 0.0 /100 | #347 | Tragic 10.0% |
Demographics Similar to Immigrants from Ecuador by Single Mother Households
In terms of single mother households, the demographic groups most similar to Immigrants from Ecuador are Cajun (7.3%, a difference of 0.050%), Mexican American Indian (7.4%, a difference of 0.37%), Alaskan Athabascan (7.3%, a difference of 0.44%), Malaysian (7.3%, a difference of 0.46%), and Seminole (7.4%, a difference of 0.73%).
| Demographics | Rating | Rank | Single Mother Households |
| Dutch West Indians | 0.4 /100 | #247 | Tragic 7.3% |
| Spanish American Indians | 0.4 /100 | #248 | Tragic 7.3% |
| Bermudans | 0.4 /100 | #249 | Tragic 7.3% |
| Immigrants | Africa | 0.4 /100 | #250 | Tragic 7.3% |
| Malaysians | 0.3 /100 | #251 | Tragic 7.3% |
| Alaskan Athabascans | 0.3 /100 | #252 | Tragic 7.3% |
| Cajuns | 0.3 /100 | #253 | Tragic 7.3% |
| Immigrants | Ecuador | 0.3 /100 | #254 | Tragic 7.3% |
| Mexican American Indians | 0.2 /100 | #255 | Tragic 7.4% |
| Seminole | 0.2 /100 | #256 | Tragic 7.4% |
| Alaska Natives | 0.2 /100 | #257 | Tragic 7.4% |
| Pueblo | 0.2 /100 | #258 | Tragic 7.4% |
| Immigrants | Yemen | 0.2 /100 | #259 | Tragic 7.4% |
| Immigrants | Zaire | 0.2 /100 | #260 | Tragic 7.4% |
| Japanese | 0.2 /100 | #261 | Tragic 7.4% |