Yugoslavian vs Immigrants from Ecuador Single Mother Households
COMPARE
Yugoslavian
Immigrants from Ecuador
Single Mother Households
Single Mother Households Comparison
Yugoslavians
Immigrants from Ecuador
6.1%
SINGLE MOTHER HOUSEHOLDS
73.1/ 100
METRIC RATING
159th/ 347
METRIC RANK
7.3%
SINGLE MOTHER HOUSEHOLDS
0.3/ 100
METRIC RATING
254th/ 347
METRIC RANK
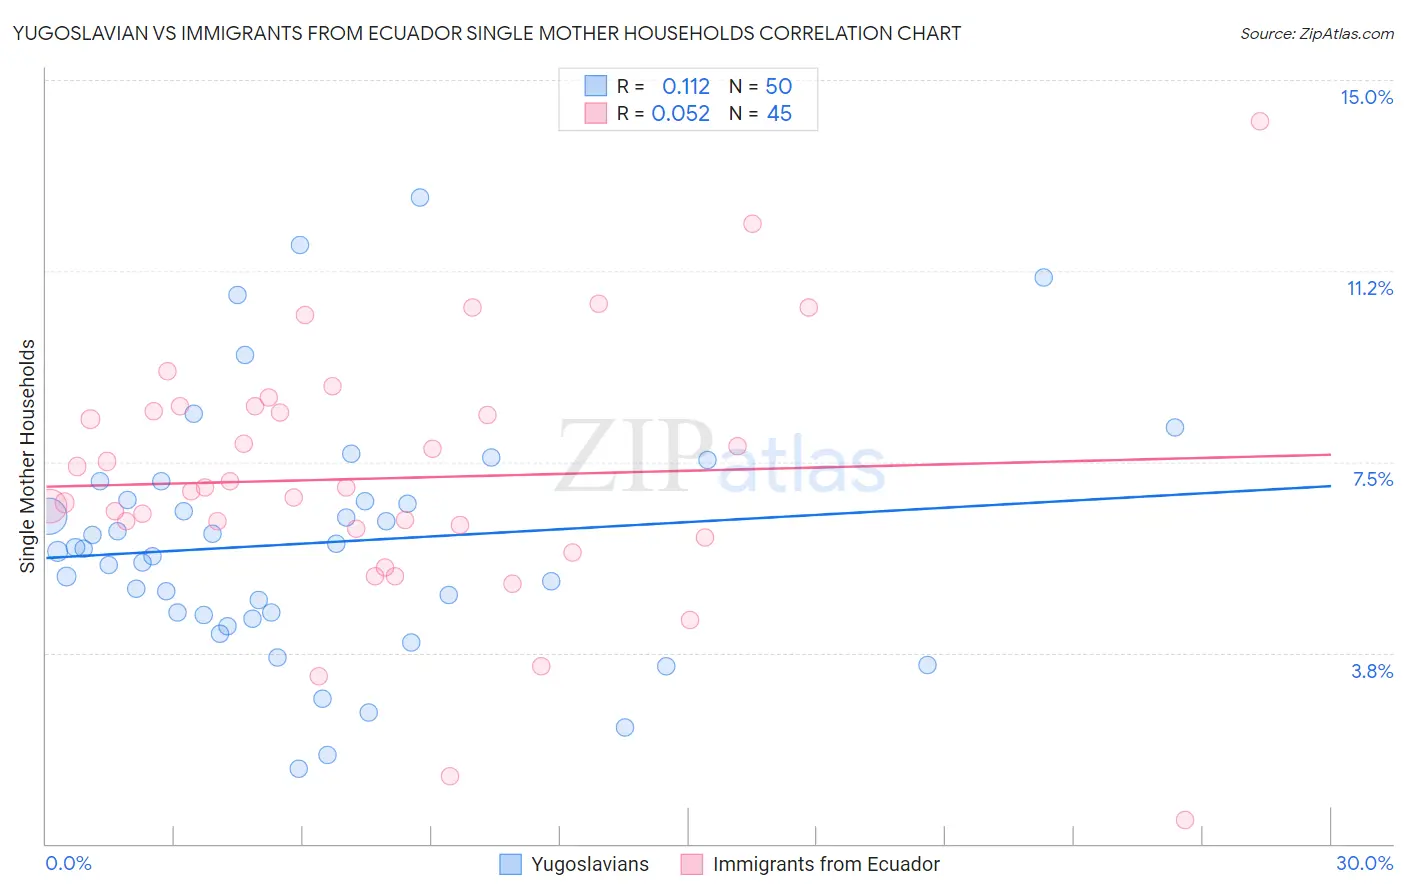
Yugoslavian vs Immigrants from Ecuador Single Mother Households Correlation Chart
The statistical analysis conducted on geographies consisting of 285,023,099 people shows a poor positive correlation between the proportion of Yugoslavians and percentage of single mother households in the United States with a correlation coefficient (R) of 0.112 and weighted average of 6.1%. Similarly, the statistical analysis conducted on geographies consisting of 270,615,585 people shows a slight positive correlation between the proportion of Immigrants from Ecuador and percentage of single mother households in the United States with a correlation coefficient (R) of 0.052 and weighted average of 7.3%, a difference of 19.6%.
Single Mother Households Correlation Summary
| Measurement | Yugoslavian | Immigrants from Ecuador |
| Minimum | 1.5% | 0.47% |
| Maximum | 12.7% | 14.2% |
| Range | 11.2% | 13.7% |
| Mean | 5.9% | 7.2% |
| Median | 5.8% | 7.0% |
| Interquartile 25% (IQ1) | 4.5% | 6.1% |
| Interquartile 75% (IQ3) | 6.7% | 8.5% |
| Interquartile Range (IQR) | 2.3% | 2.5% |
| Standard Deviation (Sample) | 2.4% | 2.5% |
| Standard Deviation (Population) | 2.4% | 2.5% |
Similar Demographics by Single Mother Households
Demographics Similar to Yugoslavians by Single Mother Households
In terms of single mother households, the demographic groups most similar to Yugoslavians are Iraqi (6.1%, a difference of 0.010%), Celtic (6.1%, a difference of 0.040%), Immigrants from Germany (6.1%, a difference of 0.090%), Chilean (6.1%, a difference of 0.17%), and Native Hawaiian (6.1%, a difference of 0.28%).
| Demographics | Rating | Rank | Single Mother Households |
| Pakistanis | 79.2 /100 | #152 | Good 6.1% |
| Immigrants | Brazil | 78.9 /100 | #153 | Good 6.1% |
| Immigrants | Philippines | 78.5 /100 | #154 | Good 6.1% |
| Whites/Caucasians | 76.5 /100 | #155 | Good 6.1% |
| Native Hawaiians | 75.0 /100 | #156 | Good 6.1% |
| Chileans | 74.2 /100 | #157 | Good 6.1% |
| Celtics | 73.3 /100 | #158 | Good 6.1% |
| Yugoslavians | 73.1 /100 | #159 | Good 6.1% |
| Iraqis | 73.0 /100 | #160 | Good 6.1% |
| Immigrants | Germany | 72.4 /100 | #161 | Good 6.1% |
| Immigrants | Zimbabwe | 69.9 /100 | #162 | Good 6.2% |
| Alsatians | 68.7 /100 | #163 | Good 6.2% |
| Immigrants | Northern Africa | 68.0 /100 | #164 | Good 6.2% |
| Immigrants | Syria | 67.4 /100 | #165 | Good 6.2% |
| Sri Lankans | 63.9 /100 | #166 | Good 6.2% |
Demographics Similar to Immigrants from Ecuador by Single Mother Households
In terms of single mother households, the demographic groups most similar to Immigrants from Ecuador are Cajun (7.3%, a difference of 0.050%), Mexican American Indian (7.4%, a difference of 0.37%), Alaskan Athabascan (7.3%, a difference of 0.44%), Malaysian (7.3%, a difference of 0.46%), and Seminole (7.4%, a difference of 0.73%).
| Demographics | Rating | Rank | Single Mother Households |
| Dutch West Indians | 0.4 /100 | #247 | Tragic 7.3% |
| Spanish American Indians | 0.4 /100 | #248 | Tragic 7.3% |
| Bermudans | 0.4 /100 | #249 | Tragic 7.3% |
| Immigrants | Africa | 0.4 /100 | #250 | Tragic 7.3% |
| Malaysians | 0.3 /100 | #251 | Tragic 7.3% |
| Alaskan Athabascans | 0.3 /100 | #252 | Tragic 7.3% |
| Cajuns | 0.3 /100 | #253 | Tragic 7.3% |
| Immigrants | Ecuador | 0.3 /100 | #254 | Tragic 7.3% |
| Mexican American Indians | 0.2 /100 | #255 | Tragic 7.4% |
| Seminole | 0.2 /100 | #256 | Tragic 7.4% |
| Alaska Natives | 0.2 /100 | #257 | Tragic 7.4% |
| Pueblo | 0.2 /100 | #258 | Tragic 7.4% |
| Immigrants | Yemen | 0.2 /100 | #259 | Tragic 7.4% |
| Immigrants | Zaire | 0.2 /100 | #260 | Tragic 7.4% |
| Japanese | 0.2 /100 | #261 | Tragic 7.4% |