Menominee vs Immigrants from Central America Single Mother Households
COMPARE
Menominee
Immigrants from Central America
Single Mother Households
Single Mother Households Comparison
Menominee
Immigrants from Central America
9.2%
SINGLE MOTHER HOUSEHOLDS
0.0/ 100
METRIC RATING
342nd/ 347
METRIC RANK
8.1%
SINGLE MOTHER HOUSEHOLDS
0.0/ 100
METRIC RATING
308th/ 347
METRIC RANK
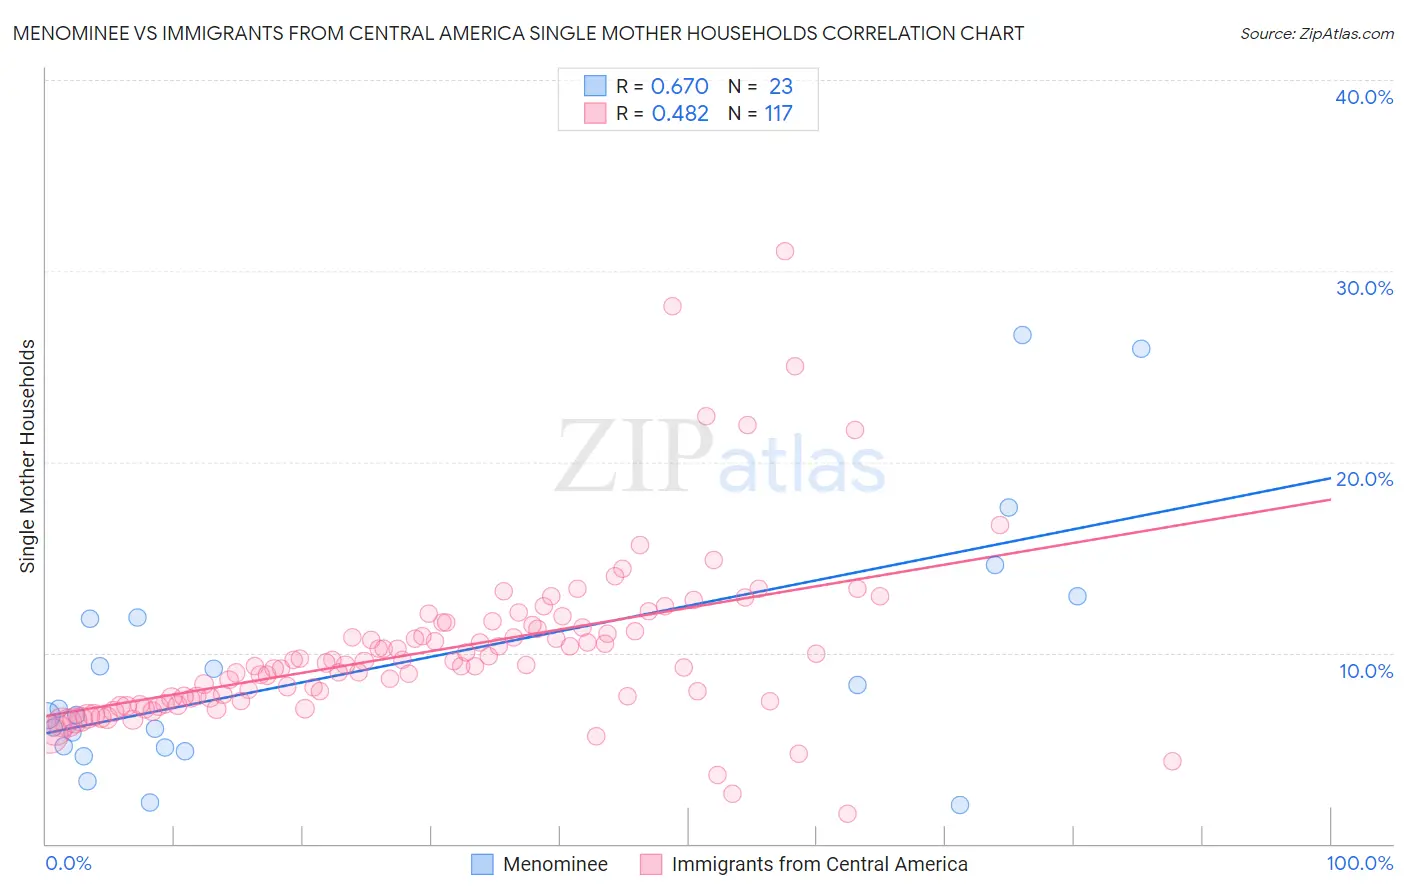
Menominee vs Immigrants from Central America Single Mother Households Correlation Chart
The statistical analysis conducted on geographies consisting of 45,774,127 people shows a significant positive correlation between the proportion of Menominee and percentage of single mother households in the United States with a correlation coefficient (R) of 0.670 and weighted average of 9.2%. Similarly, the statistical analysis conducted on geographies consisting of 533,472,888 people shows a moderate positive correlation between the proportion of Immigrants from Central America and percentage of single mother households in the United States with a correlation coefficient (R) of 0.482 and weighted average of 8.1%, a difference of 13.8%.
Single Mother Households Correlation Summary
| Measurement | Menominee | Immigrants from Central America |
| Minimum | 2.0% | 1.6% |
| Maximum | 26.7% | 31.0% |
| Range | 24.6% | 29.5% |
| Mean | 9.3% | 10.1% |
| Median | 6.7% | 9.4% |
| Interquartile 25% (IQ1) | 5.0% | 7.5% |
| Interquartile 75% (IQ3) | 11.9% | 11.4% |
| Interquartile Range (IQR) | 6.9% | 3.9% |
| Standard Deviation (Sample) | 6.6% | 4.4% |
| Standard Deviation (Population) | 6.5% | 4.4% |
Similar Demographics by Single Mother Households
Demographics Similar to Menominee by Single Mother Households
In terms of single mother households, the demographic groups most similar to Menominee are Dominican (9.2%, a difference of 0.21%), Tohono O'odham (9.1%, a difference of 0.32%), Lumbee (9.1%, a difference of 0.68%), Black/African American (9.0%, a difference of 1.9%), and Cape Verdean (8.9%, a difference of 3.5%).
| Demographics | Rating | Rank | Single Mother Households |
| Liberians | 0.0 /100 | #333 | Tragic 8.6% |
| Immigrants | Liberia | 0.0 /100 | #334 | Tragic 8.7% |
| Immigrants | Dominica | 0.0 /100 | #335 | Tragic 8.7% |
| Puerto Ricans | 0.0 /100 | #336 | Tragic 8.7% |
| Navajo | 0.0 /100 | #337 | Tragic 8.8% |
| Cape Verdeans | 0.0 /100 | #338 | Tragic 8.9% |
| Blacks/African Americans | 0.0 /100 | #339 | Tragic 9.0% |
| Lumbee | 0.0 /100 | #340 | Tragic 9.1% |
| Tohono O'odham | 0.0 /100 | #341 | Tragic 9.1% |
| Menominee | 0.0 /100 | #342 | Tragic 9.2% |
| Dominicans | 0.0 /100 | #343 | Tragic 9.2% |
| Immigrants | Dominican Republic | 0.0 /100 | #344 | Tragic 9.5% |
| Immigrants | Cabo Verde | 0.0 /100 | #345 | Tragic 9.6% |
| Yuman | 0.0 /100 | #346 | Tragic 9.6% |
| Yup'ik | 0.0 /100 | #347 | Tragic 10.0% |
Demographics Similar to Immigrants from Central America by Single Mother Households
In terms of single mother households, the demographic groups most similar to Immigrants from Central America are Immigrants from St. Vincent and the Grenadines (8.0%, a difference of 0.020%), Immigrants from Barbados (8.0%, a difference of 0.26%), Colville (8.0%, a difference of 0.33%), Native/Alaskan (8.0%, a difference of 0.38%), and Cheyenne (8.1%, a difference of 0.44%).
| Demographics | Rating | Rank | Single Mother Households |
| Chippewa | 0.0 /100 | #301 | Tragic 8.0% |
| Immigrants | Ghana | 0.0 /100 | #302 | Tragic 8.0% |
| Immigrants | Bahamas | 0.0 /100 | #303 | Tragic 8.0% |
| Natives/Alaskans | 0.0 /100 | #304 | Tragic 8.0% |
| Colville | 0.0 /100 | #305 | Tragic 8.0% |
| Immigrants | Barbados | 0.0 /100 | #306 | Tragic 8.0% |
| Immigrants | St. Vincent and the Grenadines | 0.0 /100 | #307 | Tragic 8.0% |
| Immigrants | Central America | 0.0 /100 | #308 | Tragic 8.1% |
| Cheyenne | 0.0 /100 | #309 | Tragic 8.1% |
| Hondurans | 0.0 /100 | #310 | Tragic 8.1% |
| Immigrants | Congo | 0.0 /100 | #311 | Tragic 8.1% |
| Bangladeshis | 0.0 /100 | #312 | Tragic 8.1% |
| Immigrants | Grenada | 0.0 /100 | #313 | Tragic 8.2% |
| Immigrants | Mexico | 0.0 /100 | #314 | Tragic 8.2% |
| Immigrants | Western Africa | 0.0 /100 | #315 | Tragic 8.2% |