Menominee vs Immigrants from Italy Single Mother Households
COMPARE
Menominee
Immigrants from Italy
Single Mother Households
Single Mother Households Comparison
Menominee
Immigrants from Italy
9.2%
SINGLE MOTHER HOUSEHOLDS
0.0/ 100
METRIC RATING
342nd/ 347
METRIC RANK
5.8%
SINGLE MOTHER HOUSEHOLDS
95.8/ 100
METRIC RATING
108th/ 347
METRIC RANK
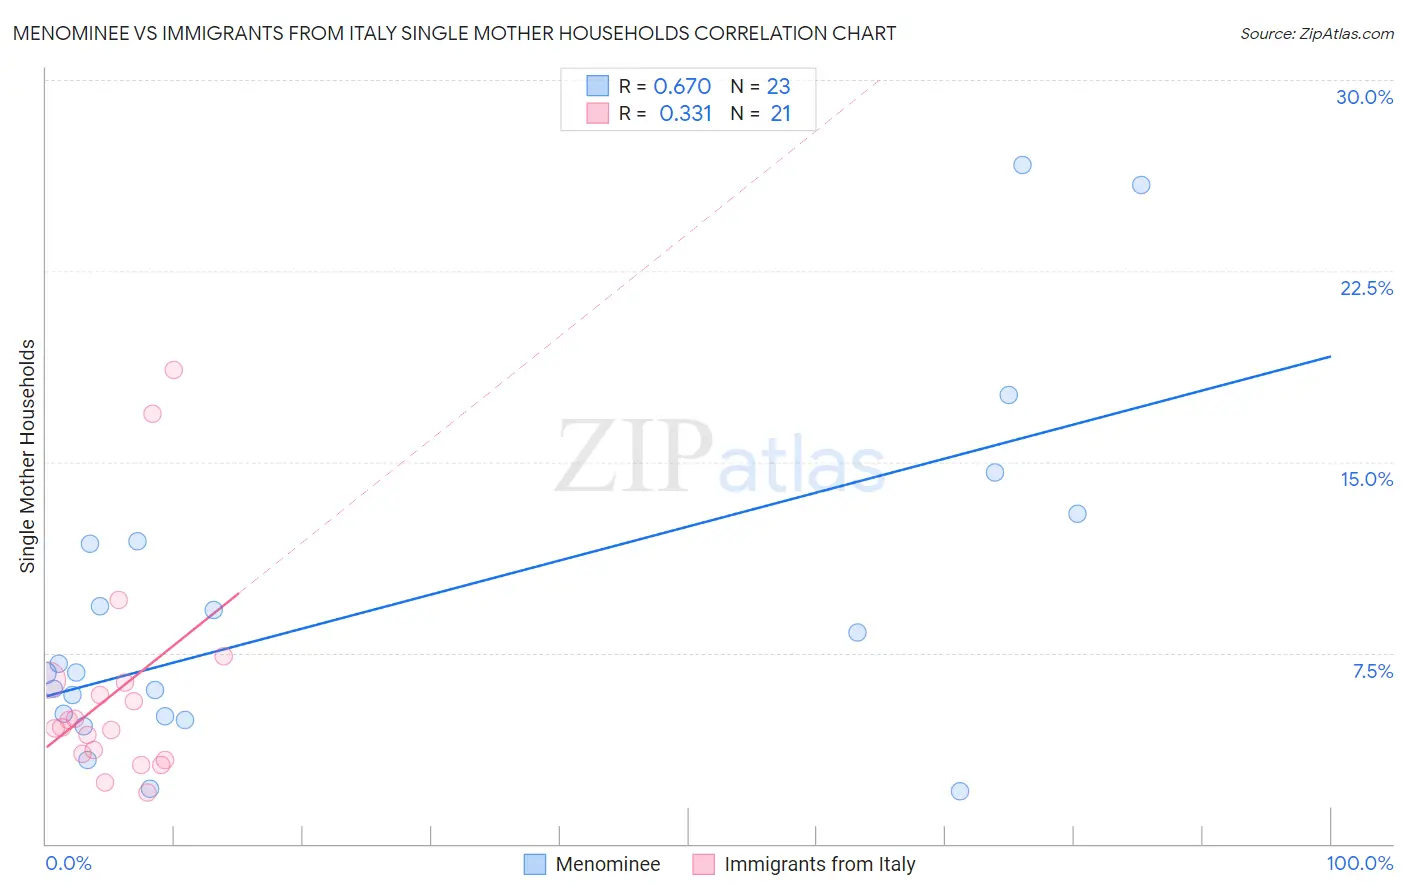
Menominee vs Immigrants from Italy Single Mother Households Correlation Chart
The statistical analysis conducted on geographies consisting of 45,774,127 people shows a significant positive correlation between the proportion of Menominee and percentage of single mother households in the United States with a correlation coefficient (R) of 0.670 and weighted average of 9.2%. Similarly, the statistical analysis conducted on geographies consisting of 323,232,887 people shows a mild positive correlation between the proportion of Immigrants from Italy and percentage of single mother households in the United States with a correlation coefficient (R) of 0.331 and weighted average of 5.8%, a difference of 58.7%.
Single Mother Households Correlation Summary
| Measurement | Menominee | Immigrants from Italy |
| Minimum | 2.0% | 2.0% |
| Maximum | 26.7% | 18.6% |
| Range | 24.6% | 16.6% |
| Mean | 9.3% | 6.0% |
| Median | 6.7% | 4.6% |
| Interquartile 25% (IQ1) | 5.0% | 3.4% |
| Interquartile 75% (IQ3) | 11.9% | 6.4% |
| Interquartile Range (IQR) | 6.9% | 3.0% |
| Standard Deviation (Sample) | 6.6% | 4.3% |
| Standard Deviation (Population) | 6.5% | 4.2% |
Similar Demographics by Single Mother Households
Demographics Similar to Menominee by Single Mother Households
In terms of single mother households, the demographic groups most similar to Menominee are Dominican (9.2%, a difference of 0.21%), Tohono O'odham (9.1%, a difference of 0.32%), Lumbee (9.1%, a difference of 0.68%), Black/African American (9.0%, a difference of 1.9%), and Cape Verdean (8.9%, a difference of 3.5%).
| Demographics | Rating | Rank | Single Mother Households |
| Liberians | 0.0 /100 | #333 | Tragic 8.6% |
| Immigrants | Liberia | 0.0 /100 | #334 | Tragic 8.7% |
| Immigrants | Dominica | 0.0 /100 | #335 | Tragic 8.7% |
| Puerto Ricans | 0.0 /100 | #336 | Tragic 8.7% |
| Navajo | 0.0 /100 | #337 | Tragic 8.8% |
| Cape Verdeans | 0.0 /100 | #338 | Tragic 8.9% |
| Blacks/African Americans | 0.0 /100 | #339 | Tragic 9.0% |
| Lumbee | 0.0 /100 | #340 | Tragic 9.1% |
| Tohono O'odham | 0.0 /100 | #341 | Tragic 9.1% |
| Menominee | 0.0 /100 | #342 | Tragic 9.2% |
| Dominicans | 0.0 /100 | #343 | Tragic 9.2% |
| Immigrants | Dominican Republic | 0.0 /100 | #344 | Tragic 9.5% |
| Immigrants | Cabo Verde | 0.0 /100 | #345 | Tragic 9.6% |
| Yuman | 0.0 /100 | #346 | Tragic 9.6% |
| Yup'ik | 0.0 /100 | #347 | Tragic 10.0% |
Demographics Similar to Immigrants from Italy by Single Mother Households
In terms of single mother households, the demographic groups most similar to Immigrants from Italy are Paraguayan (5.8%, a difference of 0.010%), Immigrants from Western Europe (5.8%, a difference of 0.090%), Immigrants from Ukraine (5.8%, a difference of 0.12%), British (5.8%, a difference of 0.18%), and Immigrants from England (5.8%, a difference of 0.21%).
| Demographics | Rating | Rank | Single Mother Households |
| Germans | 96.2 /100 | #101 | Exceptional 5.8% |
| English | 96.2 /100 | #102 | Exceptional 5.8% |
| Scottish | 96.2 /100 | #103 | Exceptional 5.8% |
| Northern Europeans | 96.2 /100 | #104 | Exceptional 5.8% |
| Taiwanese | 96.1 /100 | #105 | Exceptional 5.8% |
| Immigrants | Ukraine | 95.9 /100 | #106 | Exceptional 5.8% |
| Paraguayans | 95.8 /100 | #107 | Exceptional 5.8% |
| Immigrants | Italy | 95.8 /100 | #108 | Exceptional 5.8% |
| Immigrants | Western Europe | 95.7 /100 | #109 | Exceptional 5.8% |
| British | 95.5 /100 | #110 | Exceptional 5.8% |
| Immigrants | England | 95.5 /100 | #111 | Exceptional 5.8% |
| Immigrants | Kuwait | 95.4 /100 | #112 | Exceptional 5.8% |
| Mongolians | 95.3 /100 | #113 | Exceptional 5.8% |
| Dutch | 95.1 /100 | #114 | Exceptional 5.8% |
| Irish | 94.8 /100 | #115 | Exceptional 5.8% |