Delaware vs Immigrants from Ecuador Single Mother Households
COMPARE
Delaware
Immigrants from Ecuador
Single Mother Households
Single Mother Households Comparison
Delaware
Immigrants from Ecuador
6.5%
SINGLE MOTHER HOUSEHOLDS
23.3/ 100
METRIC RATING
189th/ 347
METRIC RANK
7.3%
SINGLE MOTHER HOUSEHOLDS
0.3/ 100
METRIC RATING
254th/ 347
METRIC RANK
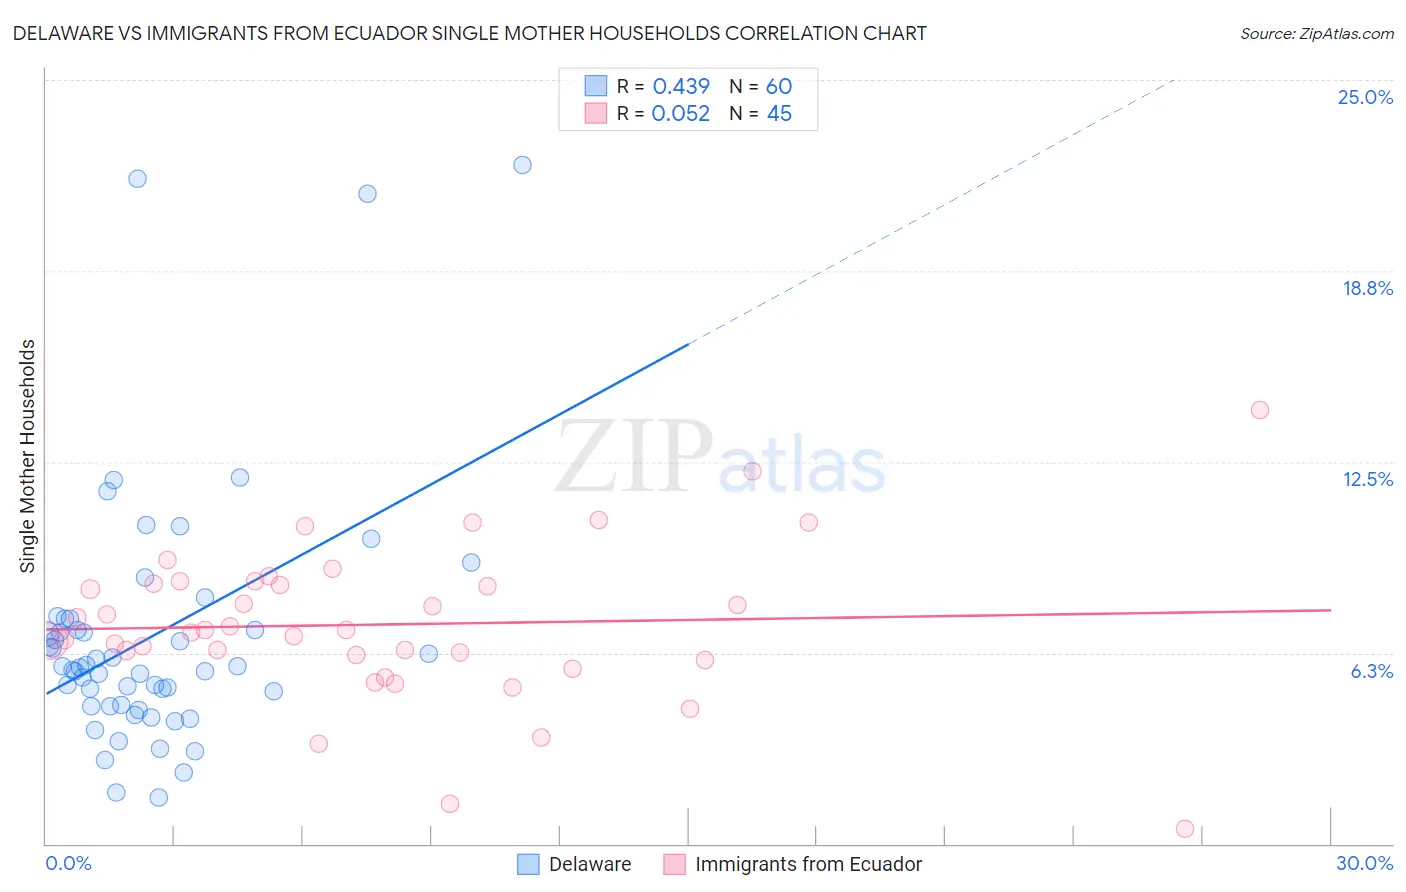
Delaware vs Immigrants from Ecuador Single Mother Households Correlation Chart
The statistical analysis conducted on geographies consisting of 96,147,855 people shows a moderate positive correlation between the proportion of Delaware and percentage of single mother households in the United States with a correlation coefficient (R) of 0.439 and weighted average of 6.5%. Similarly, the statistical analysis conducted on geographies consisting of 270,615,585 people shows a slight positive correlation between the proportion of Immigrants from Ecuador and percentage of single mother households in the United States with a correlation coefficient (R) of 0.052 and weighted average of 7.3%, a difference of 12.6%.
Single Mother Households Correlation Summary
| Measurement | Delaware | Immigrants from Ecuador |
| Minimum | 1.5% | 0.47% |
| Maximum | 22.2% | 14.2% |
| Range | 20.7% | 13.7% |
| Mean | 6.8% | 7.2% |
| Median | 5.8% | 7.0% |
| Interquartile 25% (IQ1) | 4.5% | 6.1% |
| Interquartile 75% (IQ3) | 7.2% | 8.5% |
| Interquartile Range (IQR) | 2.6% | 2.5% |
| Standard Deviation (Sample) | 4.2% | 2.5% |
| Standard Deviation (Population) | 4.1% | 2.5% |
Similar Demographics by Single Mother Households
Demographics Similar to Delaware by Single Mother Households
In terms of single mother households, the demographic groups most similar to Delaware are Ottawa (6.5%, a difference of 0.070%), Immigrants from Afghanistan (6.5%, a difference of 0.20%), Costa Rican (6.5%, a difference of 0.21%), Peruvian (6.5%, a difference of 0.26%), and Samoan (6.5%, a difference of 0.32%).
| Demographics | Rating | Rank | Single Mother Households |
| South American Indians | 33.4 /100 | #182 | Fair 6.4% |
| Spaniards | 27.8 /100 | #183 | Fair 6.5% |
| Ethiopians | 26.0 /100 | #184 | Fair 6.5% |
| Ugandans | 25.6 /100 | #185 | Fair 6.5% |
| Costa Ricans | 24.8 /100 | #186 | Fair 6.5% |
| Immigrants | Afghanistan | 24.7 /100 | #187 | Fair 6.5% |
| Ottawa | 23.8 /100 | #188 | Fair 6.5% |
| Delaware | 23.3 /100 | #189 | Fair 6.5% |
| Peruvians | 21.6 /100 | #190 | Fair 6.5% |
| Samoans | 21.2 /100 | #191 | Fair 6.5% |
| Americans | 19.0 /100 | #192 | Poor 6.6% |
| Colombians | 18.3 /100 | #193 | Poor 6.6% |
| Immigrants | Uganda | 18.3 /100 | #194 | Poor 6.6% |
| South Americans | 18.0 /100 | #195 | Poor 6.6% |
| Uruguayans | 18.0 /100 | #196 | Poor 6.6% |
Demographics Similar to Immigrants from Ecuador by Single Mother Households
In terms of single mother households, the demographic groups most similar to Immigrants from Ecuador are Cajun (7.3%, a difference of 0.050%), Mexican American Indian (7.4%, a difference of 0.37%), Alaskan Athabascan (7.3%, a difference of 0.44%), Malaysian (7.3%, a difference of 0.46%), and Seminole (7.4%, a difference of 0.73%).
| Demographics | Rating | Rank | Single Mother Households |
| Dutch West Indians | 0.4 /100 | #247 | Tragic 7.3% |
| Spanish American Indians | 0.4 /100 | #248 | Tragic 7.3% |
| Bermudans | 0.4 /100 | #249 | Tragic 7.3% |
| Immigrants | Africa | 0.4 /100 | #250 | Tragic 7.3% |
| Malaysians | 0.3 /100 | #251 | Tragic 7.3% |
| Alaskan Athabascans | 0.3 /100 | #252 | Tragic 7.3% |
| Cajuns | 0.3 /100 | #253 | Tragic 7.3% |
| Immigrants | Ecuador | 0.3 /100 | #254 | Tragic 7.3% |
| Mexican American Indians | 0.2 /100 | #255 | Tragic 7.4% |
| Seminole | 0.2 /100 | #256 | Tragic 7.4% |
| Alaska Natives | 0.2 /100 | #257 | Tragic 7.4% |
| Pueblo | 0.2 /100 | #258 | Tragic 7.4% |
| Immigrants | Yemen | 0.2 /100 | #259 | Tragic 7.4% |
| Immigrants | Zaire | 0.2 /100 | #260 | Tragic 7.4% |
| Japanese | 0.2 /100 | #261 | Tragic 7.4% |