Menominee vs Marshallese Single Mother Households
COMPARE
Menominee
Marshallese
Single Mother Households
Single Mother Households Comparison
Menominee
Marshallese
9.2%
SINGLE MOTHER HOUSEHOLDS
0.0/ 100
METRIC RATING
342nd/ 347
METRIC RANK
6.3%
SINGLE MOTHER HOUSEHOLDS
45.8/ 100
METRIC RATING
175th/ 347
METRIC RANK
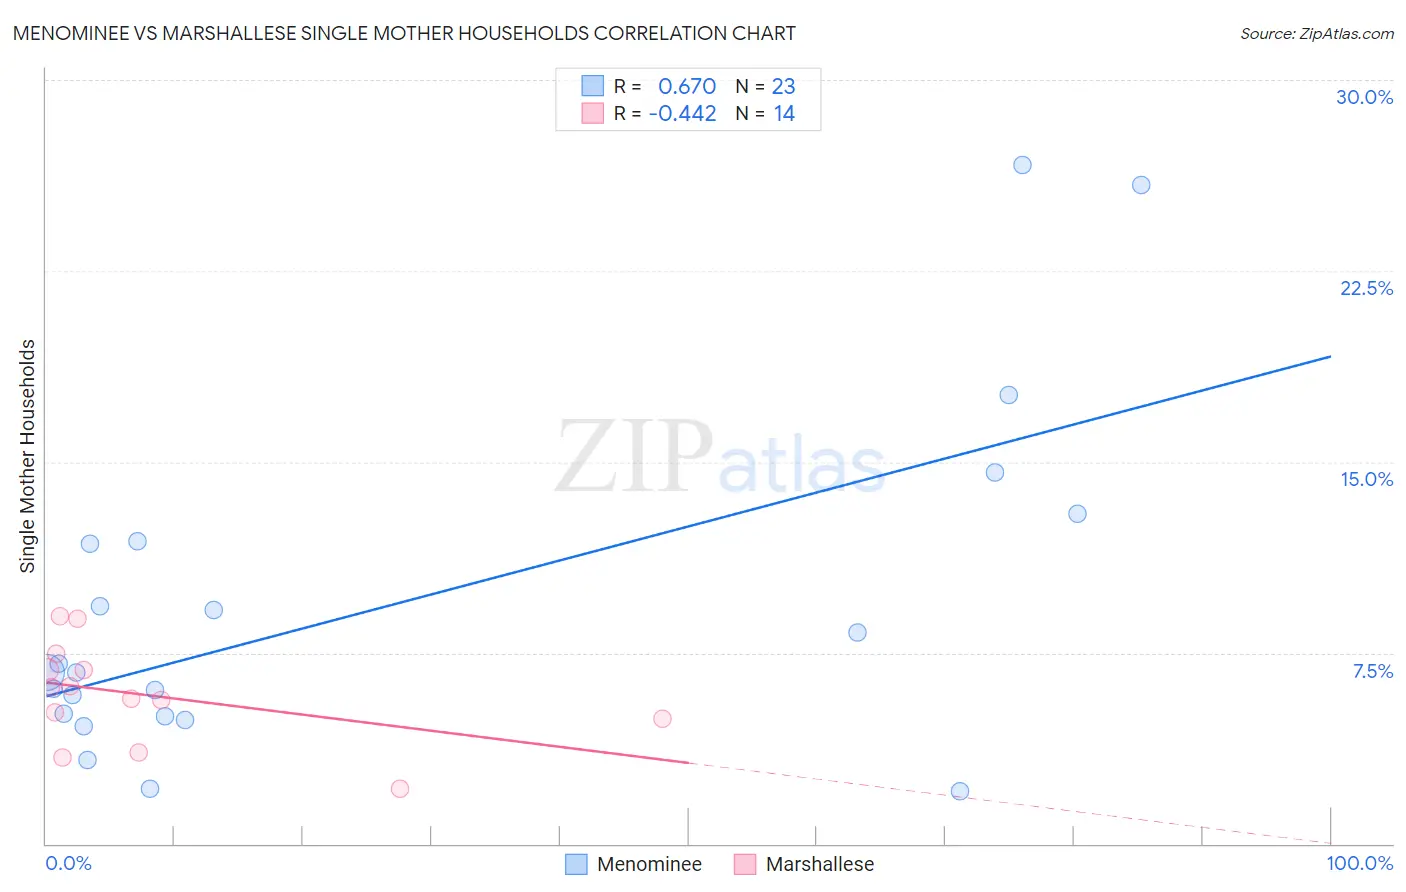
Menominee vs Marshallese Single Mother Households Correlation Chart
The statistical analysis conducted on geographies consisting of 45,774,127 people shows a significant positive correlation between the proportion of Menominee and percentage of single mother households in the United States with a correlation coefficient (R) of 0.670 and weighted average of 9.2%. Similarly, the statistical analysis conducted on geographies consisting of 14,758,592 people shows a moderate negative correlation between the proportion of Marshallese and percentage of single mother households in the United States with a correlation coefficient (R) of -0.442 and weighted average of 6.3%, a difference of 44.5%.
Single Mother Households Correlation Summary
| Measurement | Menominee | Marshallese |
| Minimum | 2.0% | 2.2% |
| Maximum | 26.7% | 8.9% |
| Range | 24.6% | 6.7% |
| Mean | 9.3% | 5.8% |
| Median | 6.7% | 5.9% |
| Interquartile 25% (IQ1) | 5.0% | 4.9% |
| Interquartile 75% (IQ3) | 11.9% | 6.8% |
| Interquartile Range (IQR) | 6.9% | 1.9% |
| Standard Deviation (Sample) | 6.6% | 1.9% |
| Standard Deviation (Population) | 6.5% | 1.9% |
Similar Demographics by Single Mother Households
Demographics Similar to Menominee by Single Mother Households
In terms of single mother households, the demographic groups most similar to Menominee are Dominican (9.2%, a difference of 0.21%), Tohono O'odham (9.1%, a difference of 0.32%), Lumbee (9.1%, a difference of 0.68%), Black/African American (9.0%, a difference of 1.9%), and Cape Verdean (8.9%, a difference of 3.5%).
| Demographics | Rating | Rank | Single Mother Households |
| Liberians | 0.0 /100 | #333 | Tragic 8.6% |
| Immigrants | Liberia | 0.0 /100 | #334 | Tragic 8.7% |
| Immigrants | Dominica | 0.0 /100 | #335 | Tragic 8.7% |
| Puerto Ricans | 0.0 /100 | #336 | Tragic 8.7% |
| Navajo | 0.0 /100 | #337 | Tragic 8.8% |
| Cape Verdeans | 0.0 /100 | #338 | Tragic 8.9% |
| Blacks/African Americans | 0.0 /100 | #339 | Tragic 9.0% |
| Lumbee | 0.0 /100 | #340 | Tragic 9.1% |
| Tohono O'odham | 0.0 /100 | #341 | Tragic 9.1% |
| Menominee | 0.0 /100 | #342 | Tragic 9.2% |
| Dominicans | 0.0 /100 | #343 | Tragic 9.2% |
| Immigrants | Dominican Republic | 0.0 /100 | #344 | Tragic 9.5% |
| Immigrants | Cabo Verde | 0.0 /100 | #345 | Tragic 9.6% |
| Yuman | 0.0 /100 | #346 | Tragic 9.6% |
| Yup'ik | 0.0 /100 | #347 | Tragic 10.0% |
Demographics Similar to Marshallese by Single Mother Households
In terms of single mother households, the demographic groups most similar to Marshallese are Immigrants from Bosnia and Herzegovina (6.3%, a difference of 0.16%), Osage (6.4%, a difference of 0.30%), Immigrants from Morocco (6.3%, a difference of 0.46%), Immigrants from Vietnam (6.3%, a difference of 0.63%), and Portuguese (6.4%, a difference of 0.65%).
| Demographics | Rating | Rank | Single Mother Households |
| Immigrants | Chile | 58.3 /100 | #168 | Average 6.3% |
| Puget Sound Salish | 58.1 /100 | #169 | Average 6.3% |
| Immigrants | Oceania | 54.6 /100 | #170 | Average 6.3% |
| Afghans | 52.5 /100 | #171 | Average 6.3% |
| Immigrants | South Eastern Asia | 52.2 /100 | #172 | Average 6.3% |
| Immigrants | Vietnam | 51.5 /100 | #173 | Average 6.3% |
| Immigrants | Morocco | 50.0 /100 | #174 | Average 6.3% |
| Marshallese | 45.8 /100 | #175 | Average 6.3% |
| Immigrants | Bosnia and Herzegovina | 44.3 /100 | #176 | Average 6.3% |
| Osage | 43.0 /100 | #177 | Average 6.4% |
| Portuguese | 40.0 /100 | #178 | Fair 6.4% |
| Hmong | 39.8 /100 | #179 | Fair 6.4% |
| Immigrants | Nepal | 36.1 /100 | #180 | Fair 6.4% |
| Spanish | 33.4 /100 | #181 | Fair 6.4% |
| South American Indians | 33.4 /100 | #182 | Fair 6.4% |