Menominee vs Immigrants from Ecuador Family Households with Children
COMPARE
Menominee
Immigrants from Ecuador
Family Households with Children
Family Households with Children Comparison
Menominee
Immigrants from Ecuador
27.6%
FAMILY HOUSEHOLDS WITH CHILDREN
78.9/ 100
METRIC RATING
149th/ 347
METRIC RANK
27.7%
FAMILY HOUSEHOLDS WITH CHILDREN
84.6/ 100
METRIC RATING
135th/ 347
METRIC RANK
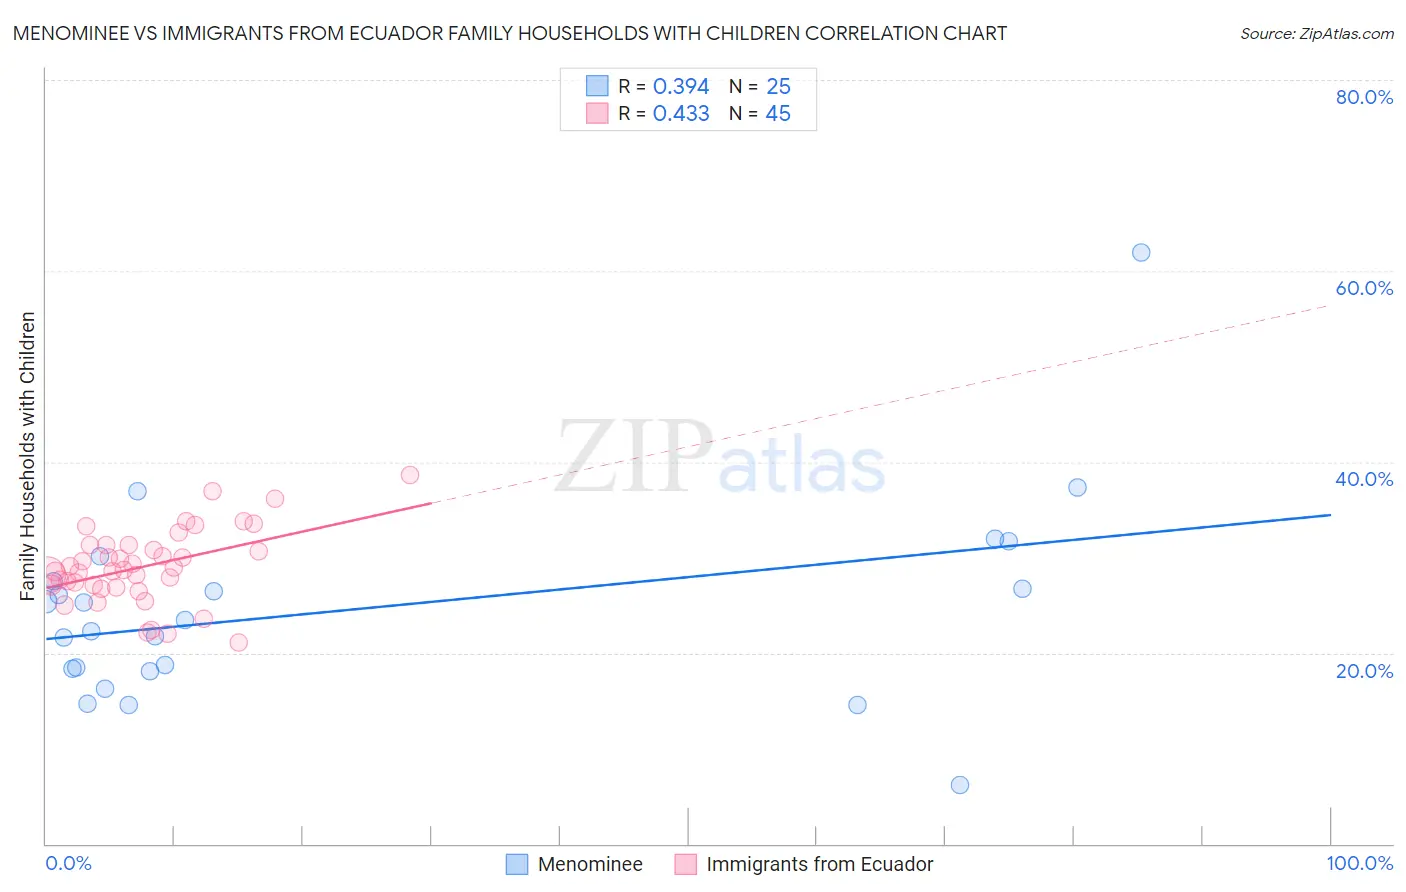
Menominee vs Immigrants from Ecuador Family Households with Children Correlation Chart
The statistical analysis conducted on geographies consisting of 45,777,730 people shows a mild positive correlation between the proportion of Menominee and percentage of family households with children in the United States with a correlation coefficient (R) of 0.394 and weighted average of 27.6%. Similarly, the statistical analysis conducted on geographies consisting of 270,851,545 people shows a moderate positive correlation between the proportion of Immigrants from Ecuador and percentage of family households with children in the United States with a correlation coefficient (R) of 0.433 and weighted average of 27.7%, a difference of 0.21%.
Family Households with Children Correlation Summary
| Measurement | Menominee | Immigrants from Ecuador |
| Minimum | 6.1% | 21.1% |
| Maximum | 61.9% | 38.7% |
| Range | 55.8% | 17.5% |
| Mean | 24.6% | 29.0% |
| Median | 23.4% | 28.7% |
| Interquartile 25% (IQ1) | 18.2% | 27.0% |
| Interquartile 75% (IQ3) | 28.8% | 31.3% |
| Interquartile Range (IQR) | 10.6% | 4.3% |
| Standard Deviation (Sample) | 10.7% | 3.9% |
| Standard Deviation (Population) | 10.5% | 3.8% |
Demographics Similar to Menominee and Immigrants from Ecuador by Family Households with Children
In terms of family households with children, the demographic groups most similar to Menominee are Osage (27.6%, a difference of 0.0%), Immigrants from Moldova (27.6%, a difference of 0.010%), Argentinean (27.6%, a difference of 0.010%), Brazilian (27.7%, a difference of 0.020%), and Immigrants from Chile (27.7%, a difference of 0.020%). Similarly, the demographic groups most similar to Immigrants from Ecuador are Immigrants from Panama (27.7%, a difference of 0.010%), Immigrants from Portugal (27.7%, a difference of 0.020%), Iranian (27.7%, a difference of 0.030%), Immigrants from Dominican Republic (27.7%, a difference of 0.030%), and Immigrants from Belize (27.7%, a difference of 0.050%).
| Demographics | Rating | Rank | Family Households with Children |
| Immigrants | Belize | 85.7 /100 | #132 | Excellent 27.7% |
| Iranians | 85.2 /100 | #133 | Excellent 27.7% |
| Immigrants | Panama | 84.9 /100 | #134 | Excellent 27.7% |
| Immigrants | Ecuador | 84.6 /100 | #135 | Excellent 27.7% |
| Immigrants | Portugal | 84.1 /100 | #136 | Excellent 27.7% |
| Immigrants | Dominican Republic | 83.9 /100 | #137 | Excellent 27.7% |
| Uruguayans | 83.2 /100 | #138 | Excellent 27.7% |
| Vietnamese | 82.6 /100 | #139 | Excellent 27.7% |
| Spanish | 81.8 /100 | #140 | Excellent 27.7% |
| Immigrants | Eastern Asia | 81.7 /100 | #141 | Excellent 27.7% |
| Swiss | 81.4 /100 | #142 | Excellent 27.7% |
| Immigrants | Eastern Africa | 80.2 /100 | #143 | Excellent 27.7% |
| Brazilians | 79.6 /100 | #144 | Good 27.7% |
| Immigrants | Chile | 79.5 /100 | #145 | Good 27.7% |
| Basques | 79.5 /100 | #146 | Good 27.7% |
| Immigrants | Moldova | 79.1 /100 | #147 | Good 27.6% |
| Osage | 79.0 /100 | #148 | Good 27.6% |
| Menominee | 78.9 /100 | #149 | Good 27.6% |
| Argentineans | 78.5 /100 | #150 | Good 27.6% |
| Portuguese | 77.8 /100 | #151 | Good 27.6% |
| Ethiopians | 77.0 /100 | #152 | Good 27.6% |