Marshallese vs Immigrants from Eritrea 11th Grade
COMPARE
Marshallese
Immigrants from Eritrea
11th Grade
11th Grade Comparison
Marshallese
Immigrants from Eritrea
92.3%
11TH GRADE
26.0/ 100
METRIC RATING
197th/ 347
METRIC RANK
91.4%
11TH GRADE
0.7/ 100
METRIC RATING
254th/ 347
METRIC RANK
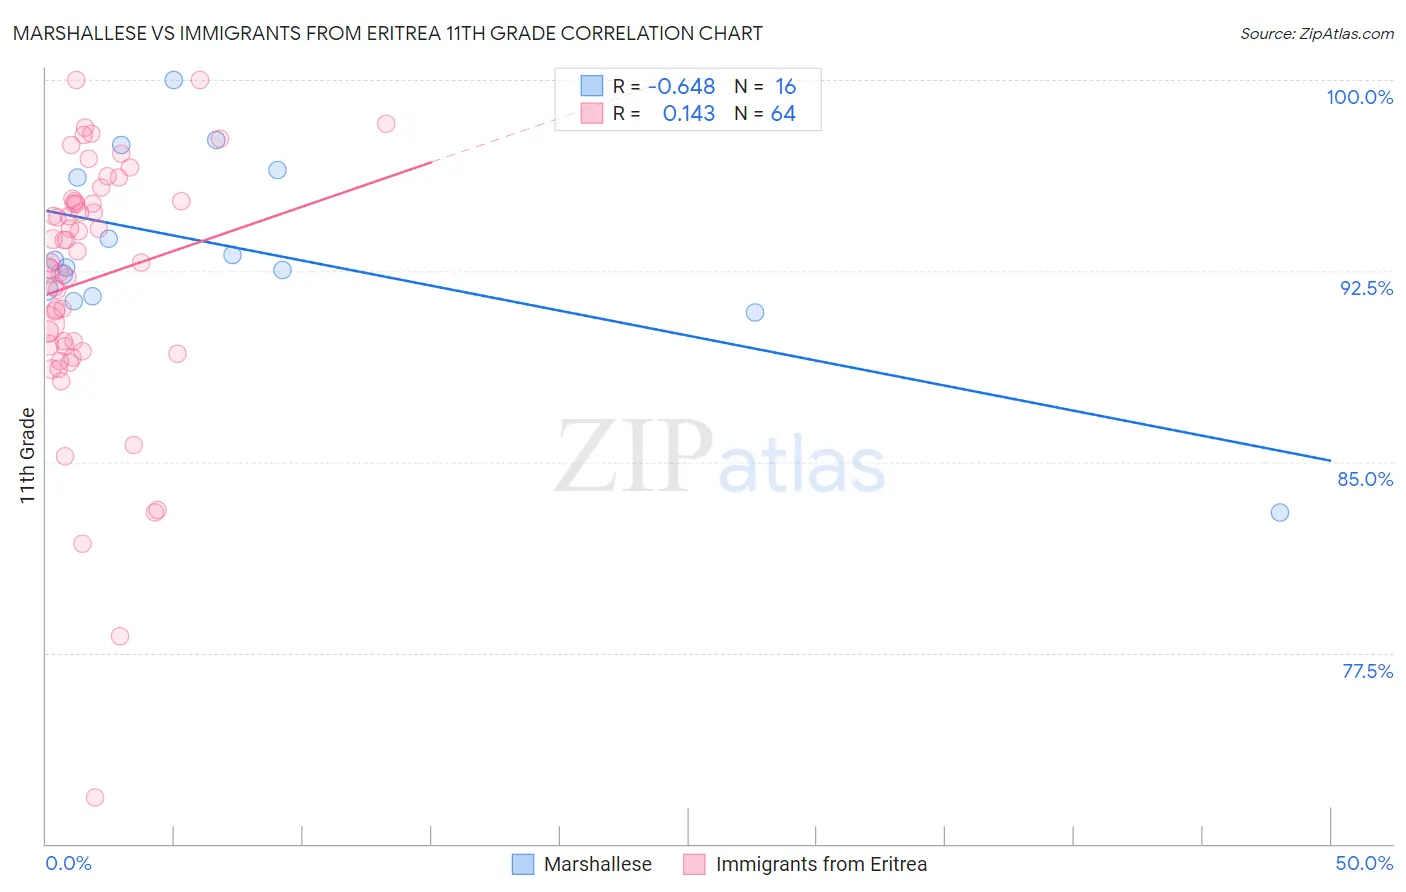
Marshallese vs Immigrants from Eritrea 11th Grade Correlation Chart
The statistical analysis conducted on geographies consisting of 14,761,315 people shows a significant negative correlation between the proportion of Marshallese and percentage of population with at least 11th grade education in the United States with a correlation coefficient (R) of -0.648 and weighted average of 92.3%. Similarly, the statistical analysis conducted on geographies consisting of 104,754,230 people shows a poor positive correlation between the proportion of Immigrants from Eritrea and percentage of population with at least 11th grade education in the United States with a correlation coefficient (R) of 0.143 and weighted average of 91.4%, a difference of 0.96%.
11th Grade Correlation Summary
| Measurement | Marshallese | Immigrants from Eritrea |
| Minimum | 83.0% | 71.8% |
| Maximum | 100.0% | 100.0% |
| Range | 17.0% | 28.2% |
| Mean | 93.3% | 92.2% |
| Median | 92.8% | 93.1% |
| Interquartile 25% (IQ1) | 91.7% | 89.6% |
| Interquartile 75% (IQ3) | 96.3% | 95.2% |
| Interquartile Range (IQR) | 4.6% | 5.7% |
| Standard Deviation (Sample) | 3.8% | 5.1% |
| Standard Deviation (Population) | 3.7% | 5.1% |
Similar Demographics by 11th Grade
Demographics Similar to Marshallese by 11th Grade
In terms of 11th grade, the demographic groups most similar to Marshallese are Liberian (92.3%, a difference of 0.010%), Panamanian (92.3%, a difference of 0.010%), Hawaiian (92.3%, a difference of 0.010%), Immigrants from Uganda (92.3%, a difference of 0.010%), and Samoan (92.3%, a difference of 0.010%).
| Demographics | Rating | Rank | 11th Grade |
| Chickasaw | 31.4 /100 | #190 | Fair 92.3% |
| French American Indians | 30.8 /100 | #191 | Fair 92.3% |
| Immigrants | Syria | 30.4 /100 | #192 | Fair 92.3% |
| Moroccans | 28.7 /100 | #193 | Fair 92.3% |
| Sioux | 28.5 /100 | #194 | Fair 92.3% |
| Liberians | 26.8 /100 | #195 | Fair 92.3% |
| Panamanians | 26.4 /100 | #196 | Fair 92.3% |
| Marshallese | 26.0 /100 | #197 | Fair 92.3% |
| Hawaiians | 25.5 /100 | #198 | Fair 92.3% |
| Immigrants | Uganda | 25.2 /100 | #199 | Fair 92.3% |
| Samoans | 25.1 /100 | #200 | Fair 92.3% |
| Immigrants | China | 25.1 /100 | #201 | Fair 92.3% |
| Immigrants | Eastern Africa | 24.1 /100 | #202 | Fair 92.3% |
| Immigrants | Sudan | 23.5 /100 | #203 | Fair 92.3% |
| Immigrants | Hong Kong | 23.3 /100 | #204 | Fair 92.2% |
Demographics Similar to Immigrants from Eritrea by 11th Grade
In terms of 11th grade, the demographic groups most similar to Immigrants from Eritrea are Black/African American (91.4%, a difference of 0.010%), Immigrants from Senegal (91.4%, a difference of 0.010%), Immigrants from Nigeria (91.4%, a difference of 0.020%), Immigrants from South America (91.4%, a difference of 0.020%), and Cajun (91.4%, a difference of 0.020%).
| Demographics | Rating | Rank | 11th Grade |
| Immigrants | Philippines | 1.0 /100 | #247 | Tragic 91.5% |
| Immigrants | Uzbekistan | 1.0 /100 | #248 | Tragic 91.5% |
| Peruvians | 1.0 /100 | #249 | Tragic 91.5% |
| Ghanaians | 0.9 /100 | #250 | Tragic 91.5% |
| Immigrants | Costa Rica | 0.9 /100 | #251 | Tragic 91.4% |
| Immigrants | Nigeria | 0.8 /100 | #252 | Tragic 91.4% |
| Immigrants | South America | 0.8 /100 | #253 | Tragic 91.4% |
| Immigrants | Eritrea | 0.7 /100 | #254 | Tragic 91.4% |
| Blacks/African Americans | 0.7 /100 | #255 | Tragic 91.4% |
| Immigrants | Senegal | 0.7 /100 | #256 | Tragic 91.4% |
| Cajuns | 0.7 /100 | #257 | Tragic 91.4% |
| Immigrants | Colombia | 0.6 /100 | #258 | Tragic 91.4% |
| Jamaicans | 0.6 /100 | #259 | Tragic 91.4% |
| Spanish Americans | 0.6 /100 | #260 | Tragic 91.4% |
| Taiwanese | 0.6 /100 | #261 | Tragic 91.3% |