Marshallese vs Immigrants from Eritrea Female Poverty Among 18-24 Year Olds
COMPARE
Marshallese
Immigrants from Eritrea
Female Poverty Among 18-24 Year Olds
Female Poverty Among 18-24 Year Olds Comparison
Marshallese
Immigrants from Eritrea
20.9%
FEMALE POVERTY AMONG 18-24 YEAR OLDS
3.4/ 100
METRIC RATING
243rd/ 347
METRIC RANK
20.9%
FEMALE POVERTY AMONG 18-24 YEAR OLDS
4.2/ 100
METRIC RATING
241st/ 347
METRIC RANK
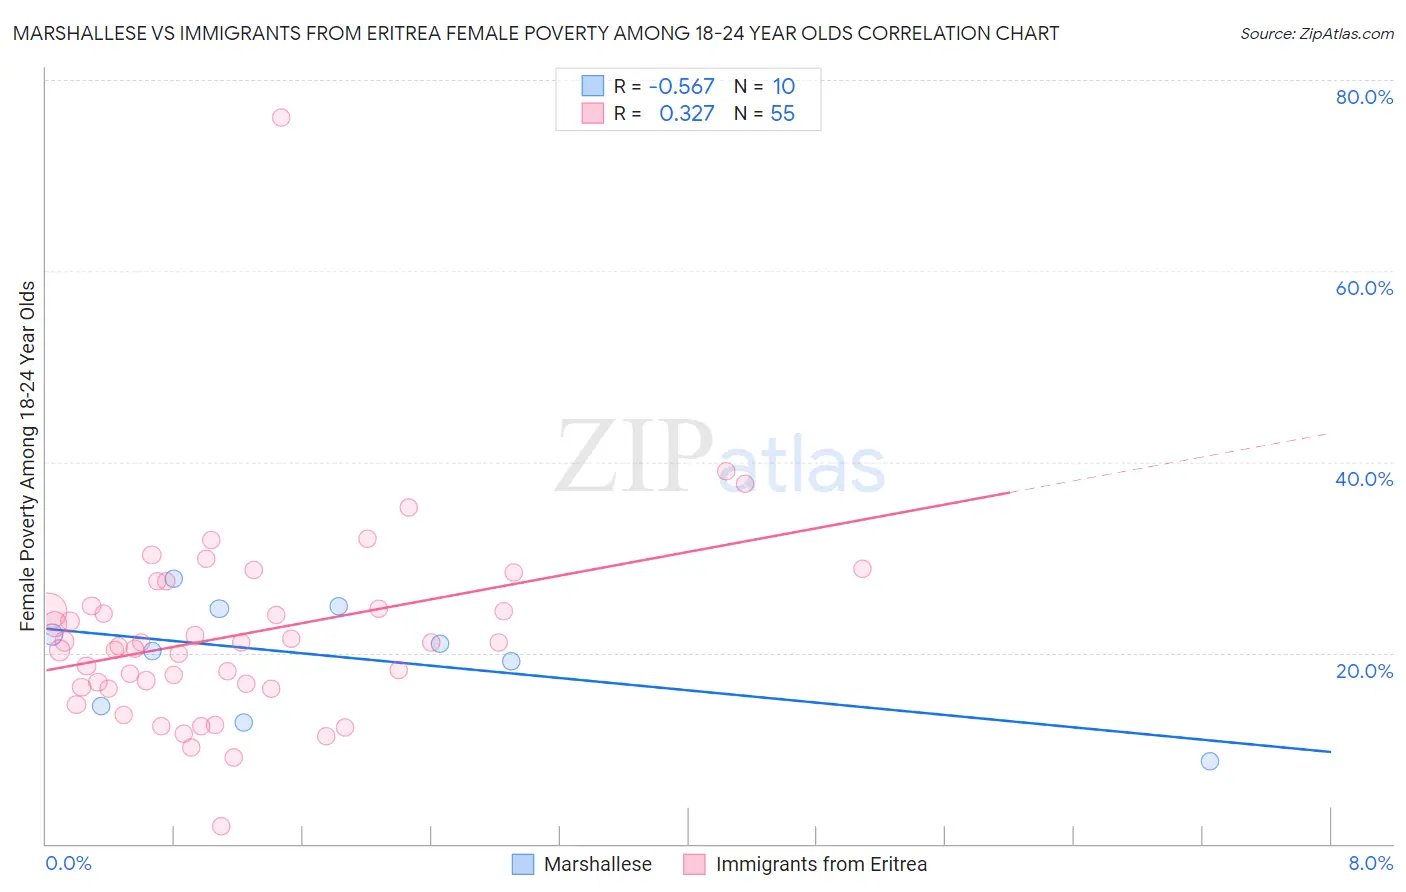
Marshallese vs Immigrants from Eritrea Female Poverty Among 18-24 Year Olds Correlation Chart
The statistical analysis conducted on geographies consisting of 14,709,952 people shows a substantial negative correlation between the proportion of Marshallese and poverty level among females between the ages 18 and 24 in the United States with a correlation coefficient (R) of -0.567 and weighted average of 20.9%. Similarly, the statistical analysis conducted on geographies consisting of 104,465,492 people shows a mild positive correlation between the proportion of Immigrants from Eritrea and poverty level among females between the ages 18 and 24 in the United States with a correlation coefficient (R) of 0.327 and weighted average of 20.9%, a difference of 0.24%.
Female Poverty Among 18-24 Year Olds Correlation Summary
| Measurement | Marshallese | Immigrants from Eritrea |
| Minimum | 8.7% | 1.8% |
| Maximum | 27.8% | 76.0% |
| Range | 19.1% | 74.2% |
| Mean | 19.5% | 21.9% |
| Median | 20.6% | 21.0% |
| Interquartile 25% (IQ1) | 14.4% | 16.4% |
| Interquartile 75% (IQ3) | 24.6% | 24.9% |
| Interquartile Range (IQR) | 10.2% | 8.5% |
| Standard Deviation (Sample) | 6.0% | 10.5% |
| Standard Deviation (Population) | 5.7% | 10.4% |
Demographics Similar to Marshallese and Immigrants from Eritrea by Female Poverty Among 18-24 Year Olds
In terms of female poverty among 18-24 year olds, the demographic groups most similar to Marshallese are Immigrants from Thailand (20.9%, a difference of 0.010%), Aleut (20.9%, a difference of 0.040%), Immigrants from Australia (20.9%, a difference of 0.12%), Immigrants from Africa (21.0%, a difference of 0.18%), and Israeli (20.9%, a difference of 0.23%). Similarly, the demographic groups most similar to Immigrants from Eritrea are Israeli (20.9%, a difference of 0.010%), Luxembourger (20.9%, a difference of 0.020%), Immigrants from Guatemala (20.9%, a difference of 0.040%), Immigrants from Singapore (20.9%, a difference of 0.050%), and Scottish (20.9%, a difference of 0.090%).
| Demographics | Rating | Rank | Female Poverty Among 18-24 Year Olds |
| Finns | 6.0 /100 | #232 | Tragic 20.8% |
| Immigrants | Denmark | 5.8 /100 | #233 | Tragic 20.8% |
| Welsh | 5.4 /100 | #234 | Tragic 20.8% |
| Immigrants | Uganda | 5.1 /100 | #235 | Tragic 20.8% |
| Okinawans | 4.9 /100 | #236 | Tragic 20.8% |
| Scottish | 4.5 /100 | #237 | Tragic 20.9% |
| Immigrants | Singapore | 4.4 /100 | #238 | Tragic 20.9% |
| Immigrants | Guatemala | 4.3 /100 | #239 | Tragic 20.9% |
| Luxembourgers | 4.2 /100 | #240 | Tragic 20.9% |
| Immigrants | Eritrea | 4.2 /100 | #241 | Tragic 20.9% |
| Israelis | 4.1 /100 | #242 | Tragic 20.9% |
| Marshallese | 3.4 /100 | #243 | Tragic 20.9% |
| Immigrants | Thailand | 3.4 /100 | #244 | Tragic 20.9% |
| Aleuts | 3.3 /100 | #245 | Tragic 20.9% |
| Immigrants | Australia | 3.1 /100 | #246 | Tragic 20.9% |
| Immigrants | Africa | 3.0 /100 | #247 | Tragic 21.0% |
| Immigrants | Kenya | 2.5 /100 | #248 | Tragic 21.0% |
| Carpatho Rusyns | 2.5 /100 | #249 | Tragic 21.0% |
| Immigrants | West Indies | 2.2 /100 | #250 | Tragic 21.0% |
| West Indians | 1.9 /100 | #251 | Tragic 21.1% |
| South Africans | 1.6 /100 | #252 | Tragic 21.1% |