Maltese vs Yakama Married-couple Households
COMPARE
Maltese
Yakama
Married-couple Households
Married-couple Households Comparison
Maltese
Yakama
49.2%
MARRIED-COUPLE HOUSEHOLDS
99.8/ 100
METRIC RATING
29th/ 347
METRIC RANK
45.2%
MARRIED-COUPLE HOUSEHOLDS
5.8/ 100
METRIC RATING
213th/ 347
METRIC RANK
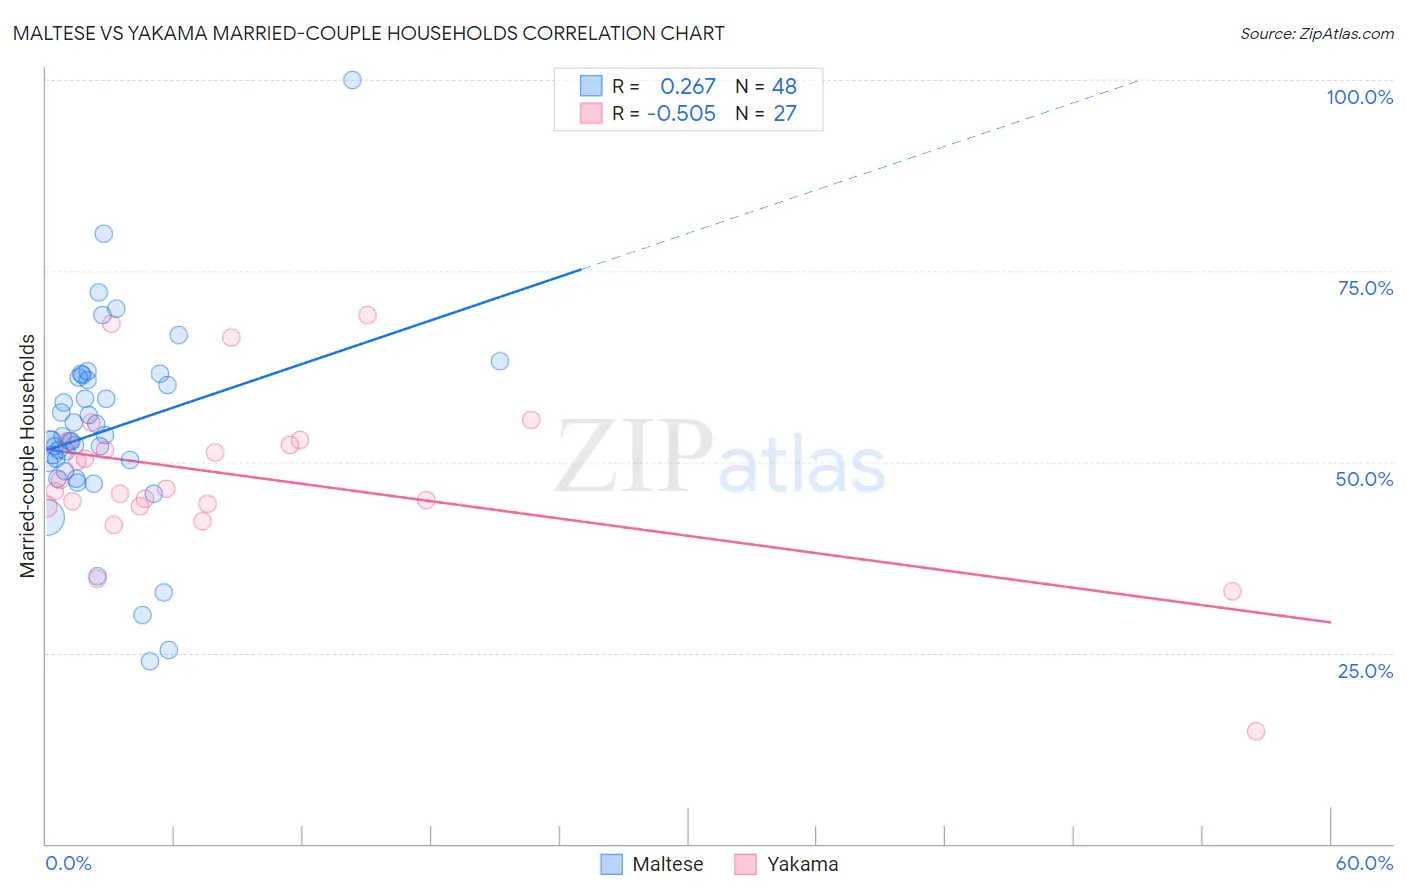
Maltese vs Yakama Married-couple Households Correlation Chart
The statistical analysis conducted on geographies consisting of 126,420,925 people shows a weak positive correlation between the proportion of Maltese and percentage of married-couple family households in the United States with a correlation coefficient (R) of 0.267 and weighted average of 49.2%. Similarly, the statistical analysis conducted on geographies consisting of 19,917,879 people shows a substantial negative correlation between the proportion of Yakama and percentage of married-couple family households in the United States with a correlation coefficient (R) of -0.505 and weighted average of 45.2%, a difference of 8.7%.
Married-couple Households Correlation Summary
| Measurement | Maltese | Yakama |
| Minimum | 23.8% | 14.7% |
| Maximum | 100.0% | 69.2% |
| Range | 76.2% | 54.6% |
| Mean | 54.2% | 48.0% |
| Median | 52.9% | 46.5% |
| Interquartile 25% (IQ1) | 49.4% | 44.3% |
| Interquartile 75% (IQ3) | 60.8% | 52.8% |
| Interquartile Range (IQR) | 11.5% | 8.5% |
| Standard Deviation (Sample) | 12.9% | 10.8% |
| Standard Deviation (Population) | 12.8% | 10.6% |
Similar Demographics by Married-couple Households
Demographics Similar to Maltese by Married-couple Households
In terms of married-couple households, the demographic groups most similar to Maltese are German (49.2%, a difference of 0.010%), Bolivian (49.2%, a difference of 0.020%), Native Hawaiian (49.1%, a difference of 0.12%), Hungarian (49.1%, a difference of 0.18%), and Bhutanese (49.3%, a difference of 0.20%).
| Demographics | Rating | Rank | Married-couple Households |
| Asians | 99.9 /100 | #22 | Exceptional 49.5% |
| Dutch | 99.9 /100 | #23 | Exceptional 49.5% |
| Czechs | 99.9 /100 | #24 | Exceptional 49.4% |
| Immigrants | Philippines | 99.9 /100 | #25 | Exceptional 49.3% |
| Immigrants | Scotland | 99.8 /100 | #26 | Exceptional 49.3% |
| Bhutanese | 99.8 /100 | #27 | Exceptional 49.3% |
| Germans | 99.8 /100 | #28 | Exceptional 49.2% |
| Maltese | 99.8 /100 | #29 | Exceptional 49.2% |
| Bolivians | 99.8 /100 | #30 | Exceptional 49.2% |
| Native Hawaiians | 99.8 /100 | #31 | Exceptional 49.1% |
| Hungarians | 99.8 /100 | #32 | Exceptional 49.1% |
| Immigrants | Asia | 99.7 /100 | #33 | Exceptional 49.1% |
| Italians | 99.7 /100 | #34 | Exceptional 49.0% |
| Scottish | 99.7 /100 | #35 | Exceptional 49.0% |
| Iranians | 99.7 /100 | #36 | Exceptional 49.0% |
Demographics Similar to Yakama by Married-couple Households
In terms of married-couple households, the demographic groups most similar to Yakama are Japanese (45.2%, a difference of 0.020%), Immigrants from Nepal (45.2%, a difference of 0.040%), Immigrants from Portugal (45.2%, a difference of 0.050%), Panamanian (45.2%, a difference of 0.070%), and Immigrants from the Azores (45.2%, a difference of 0.090%).
| Demographics | Rating | Rank | Married-couple Households |
| Uruguayans | 10.4 /100 | #206 | Poor 45.5% |
| Immigrants | France | 8.8 /100 | #207 | Tragic 45.4% |
| Hispanics or Latinos | 8.7 /100 | #208 | Tragic 45.4% |
| Immigrants | Uzbekistan | 8.4 /100 | #209 | Tragic 45.4% |
| Cubans | 7.7 /100 | #210 | Tragic 45.4% |
| Immigrants | Spain | 7.3 /100 | #211 | Tragic 45.3% |
| Creek | 6.4 /100 | #212 | Tragic 45.3% |
| Yakama | 5.8 /100 | #213 | Tragic 45.2% |
| Japanese | 5.7 /100 | #214 | Tragic 45.2% |
| Immigrants | Nepal | 5.6 /100 | #215 | Tragic 45.2% |
| Immigrants | Portugal | 5.6 /100 | #216 | Tragic 45.2% |
| Panamanians | 5.5 /100 | #217 | Tragic 45.2% |
| Immigrants | Azores | 5.3 /100 | #218 | Tragic 45.2% |
| Nicaraguans | 5.3 /100 | #219 | Tragic 45.2% |
| Immigrants | Thailand | 5.1 /100 | #220 | Tragic 45.2% |