Maltese vs Immigrants from South Central Asia Married-couple Households
COMPARE
Maltese
Immigrants from South Central Asia
Married-couple Households
Married-couple Households Comparison
Maltese
Immigrants from South Central Asia
49.2%
MARRIED-COUPLE HOUSEHOLDS
99.8/ 100
METRIC RATING
29th/ 347
METRIC RANK
50.6%
MARRIED-COUPLE HOUSEHOLDS
100.0/ 100
METRIC RATING
8th/ 347
METRIC RANK
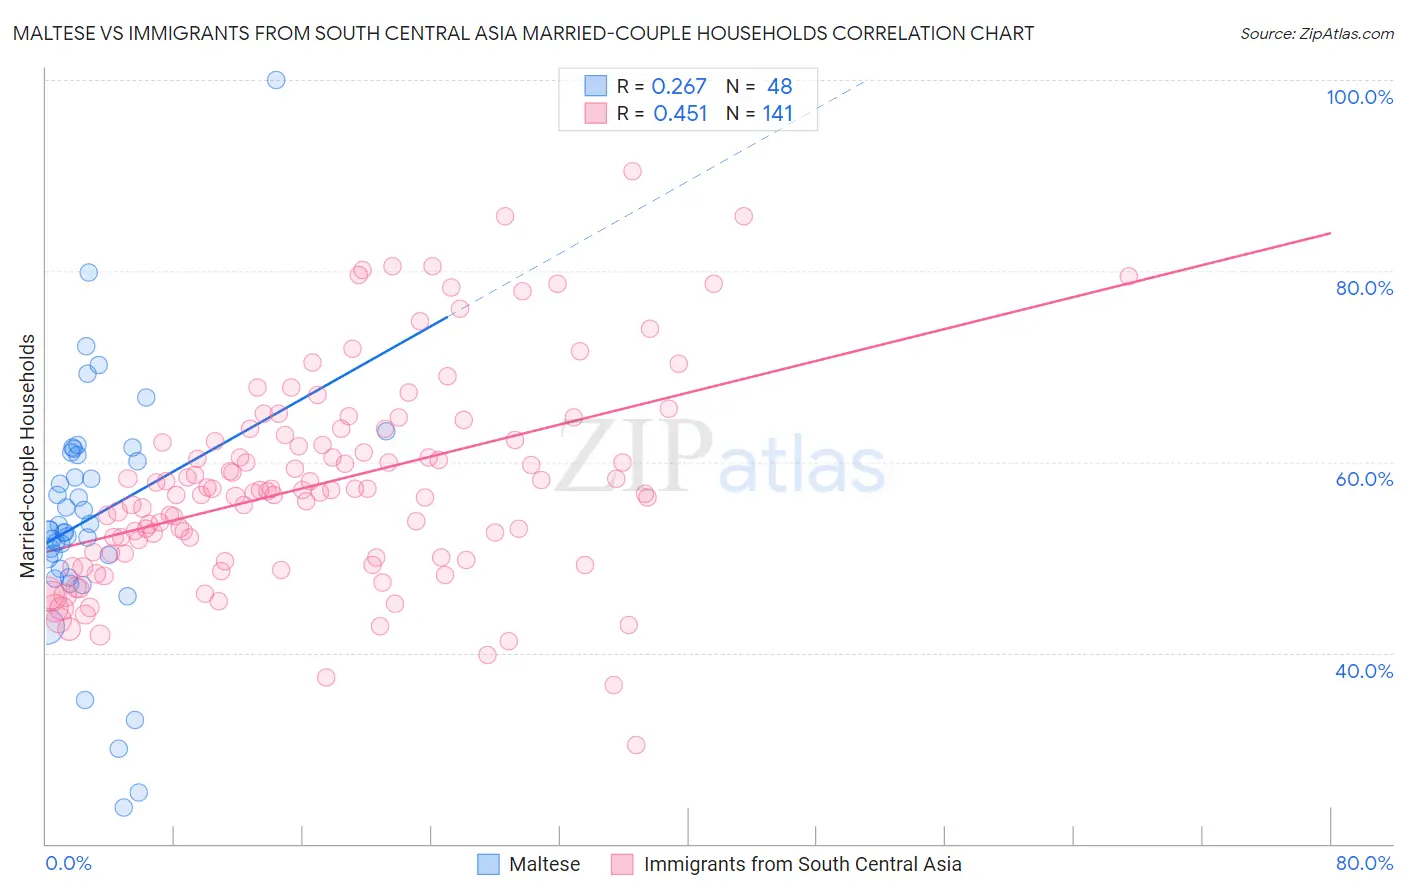
Maltese vs Immigrants from South Central Asia Married-couple Households Correlation Chart
The statistical analysis conducted on geographies consisting of 126,420,925 people shows a weak positive correlation between the proportion of Maltese and percentage of married-couple family households in the United States with a correlation coefficient (R) of 0.267 and weighted average of 49.2%. Similarly, the statistical analysis conducted on geographies consisting of 472,645,847 people shows a moderate positive correlation between the proportion of Immigrants from South Central Asia and percentage of married-couple family households in the United States with a correlation coefficient (R) of 0.451 and weighted average of 50.6%, a difference of 3.0%.
Married-couple Households Correlation Summary
| Measurement | Maltese | Immigrants from South Central Asia |
| Minimum | 23.8% | 30.4% |
| Maximum | 100.0% | 90.5% |
| Range | 76.2% | 60.1% |
| Mean | 54.2% | 57.6% |
| Median | 52.9% | 56.9% |
| Interquartile 25% (IQ1) | 49.4% | 50.0% |
| Interquartile 75% (IQ3) | 60.8% | 62.5% |
| Interquartile Range (IQR) | 11.5% | 12.5% |
| Standard Deviation (Sample) | 12.9% | 10.8% |
| Standard Deviation (Population) | 12.8% | 10.8% |
Similar Demographics by Married-couple Households
Demographics Similar to Maltese by Married-couple Households
In terms of married-couple households, the demographic groups most similar to Maltese are German (49.2%, a difference of 0.010%), Bolivian (49.2%, a difference of 0.020%), Native Hawaiian (49.1%, a difference of 0.12%), Hungarian (49.1%, a difference of 0.18%), and Bhutanese (49.3%, a difference of 0.20%).
| Demographics | Rating | Rank | Married-couple Households |
| Asians | 99.9 /100 | #22 | Exceptional 49.5% |
| Dutch | 99.9 /100 | #23 | Exceptional 49.5% |
| Czechs | 99.9 /100 | #24 | Exceptional 49.4% |
| Immigrants | Philippines | 99.9 /100 | #25 | Exceptional 49.3% |
| Immigrants | Scotland | 99.8 /100 | #26 | Exceptional 49.3% |
| Bhutanese | 99.8 /100 | #27 | Exceptional 49.3% |
| Germans | 99.8 /100 | #28 | Exceptional 49.2% |
| Maltese | 99.8 /100 | #29 | Exceptional 49.2% |
| Bolivians | 99.8 /100 | #30 | Exceptional 49.2% |
| Native Hawaiians | 99.8 /100 | #31 | Exceptional 49.1% |
| Hungarians | 99.8 /100 | #32 | Exceptional 49.1% |
| Immigrants | Asia | 99.7 /100 | #33 | Exceptional 49.1% |
| Italians | 99.7 /100 | #34 | Exceptional 49.0% |
| Scottish | 99.7 /100 | #35 | Exceptional 49.0% |
| Iranians | 99.7 /100 | #36 | Exceptional 49.0% |
Demographics Similar to Immigrants from South Central Asia by Married-couple Households
In terms of married-couple households, the demographic groups most similar to Immigrants from South Central Asia are Pennsylvania German (50.4%, a difference of 0.55%), Chinese (50.4%, a difference of 0.55%), Filipino (51.0%, a difference of 0.64%), Danish (51.1%, a difference of 0.86%), and Immigrants from Pakistan (50.1%, a difference of 1.0%).
| Demographics | Rating | Rank | Married-couple Households |
| Immigrants | India | 100.0 /100 | #1 | Exceptional 52.7% |
| Immigrants | Taiwan | 100.0 /100 | #2 | Exceptional 52.4% |
| Thais | 100.0 /100 | #3 | Exceptional 51.9% |
| Assyrians/Chaldeans/Syriacs | 100.0 /100 | #4 | Exceptional 51.8% |
| Tongans | 100.0 /100 | #5 | Exceptional 51.6% |
| Danes | 100.0 /100 | #6 | Exceptional 51.1% |
| Filipinos | 100.0 /100 | #7 | Exceptional 51.0% |
| Immigrants | South Central Asia | 100.0 /100 | #8 | Exceptional 50.6% |
| Pennsylvania Germans | 100.0 /100 | #9 | Exceptional 50.4% |
| Chinese | 100.0 /100 | #10 | Exceptional 50.4% |
| Immigrants | Pakistan | 100.0 /100 | #11 | Exceptional 50.1% |
| Swiss | 100.0 /100 | #12 | Exceptional 49.9% |
| Immigrants | Korea | 100.0 /100 | #13 | Exceptional 49.9% |
| Burmese | 100.0 /100 | #14 | Exceptional 49.8% |
| Koreans | 99.9 /100 | #15 | Exceptional 49.7% |