Salvadoran vs Yakama Married-couple Households
COMPARE
Salvadoran
Yakama
Married-couple Households
Married-couple Households Comparison
Salvadorans
Yakama
44.7%
MARRIED-COUPLE HOUSEHOLDS
1.9/ 100
METRIC RATING
227th/ 347
METRIC RANK
45.2%
MARRIED-COUPLE HOUSEHOLDS
5.8/ 100
METRIC RATING
213th/ 347
METRIC RANK
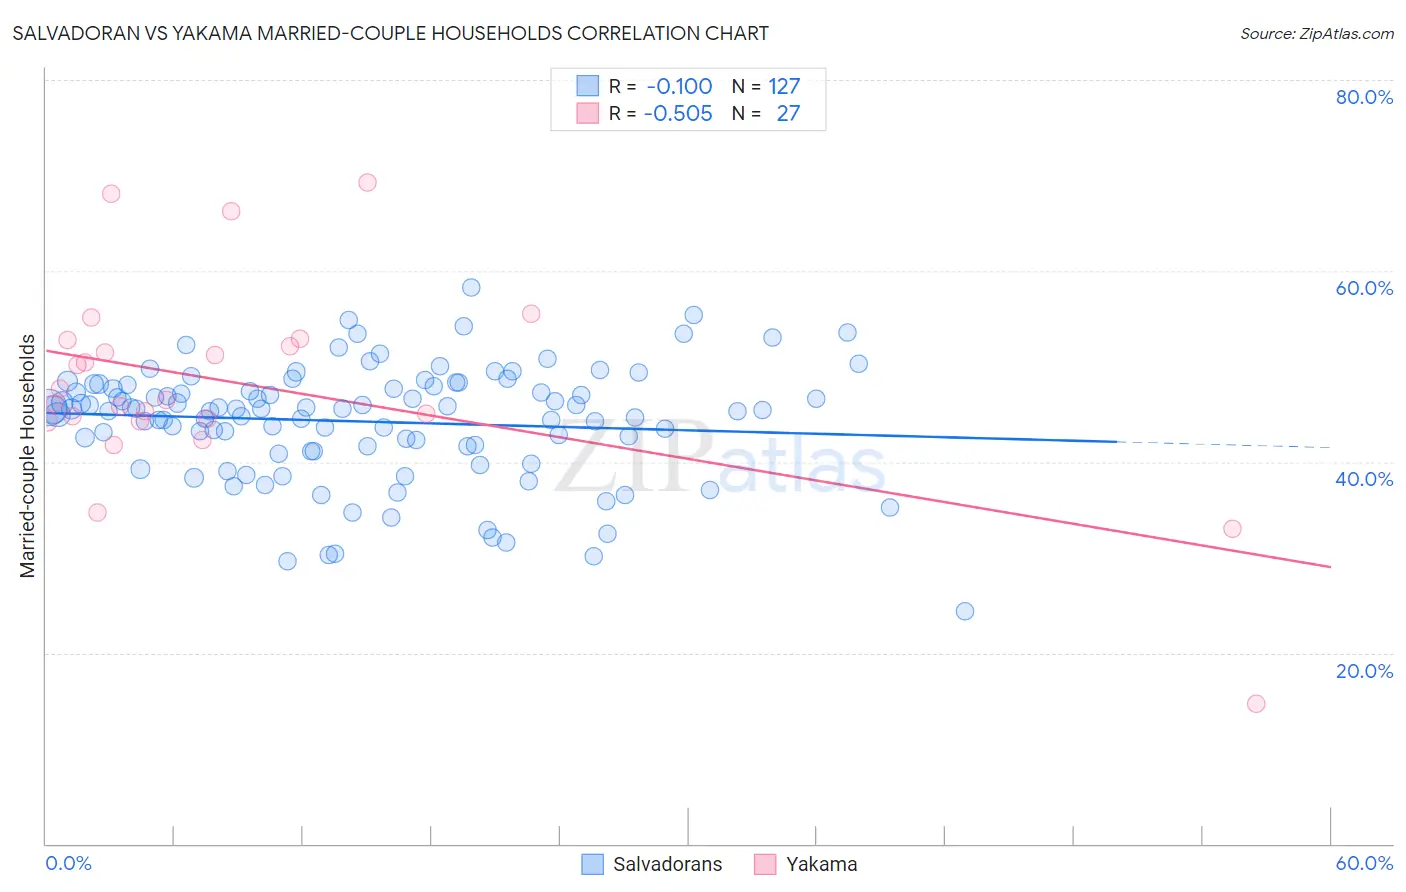
Salvadoran vs Yakama Married-couple Households Correlation Chart
The statistical analysis conducted on geographies consisting of 398,667,012 people shows a poor negative correlation between the proportion of Salvadorans and percentage of married-couple family households in the United States with a correlation coefficient (R) of -0.100 and weighted average of 44.7%. Similarly, the statistical analysis conducted on geographies consisting of 19,917,879 people shows a substantial negative correlation between the proportion of Yakama and percentage of married-couple family households in the United States with a correlation coefficient (R) of -0.505 and weighted average of 45.2%, a difference of 1.1%.
Married-couple Households Correlation Summary
| Measurement | Salvadoran | Yakama |
| Minimum | 24.4% | 14.7% |
| Maximum | 58.2% | 69.2% |
| Range | 33.9% | 54.6% |
| Mean | 44.2% | 48.0% |
| Median | 45.5% | 46.5% |
| Interquartile 25% (IQ1) | 41.6% | 44.3% |
| Interquartile 75% (IQ3) | 47.9% | 52.8% |
| Interquartile Range (IQR) | 6.3% | 8.5% |
| Standard Deviation (Sample) | 6.0% | 10.8% |
| Standard Deviation (Population) | 5.9% | 10.6% |
Demographics Similar to Salvadorans and Yakama by Married-couple Households
In terms of married-couple households, the demographic groups most similar to Salvadorans are Kenyan (44.7%, a difference of 0.13%), Immigrants from Latin America (44.7%, a difference of 0.18%), Alsatian (44.8%, a difference of 0.19%), Soviet Union (44.6%, a difference of 0.22%), and Dutch West Indian (44.9%, a difference of 0.29%). Similarly, the demographic groups most similar to Yakama are Japanese (45.2%, a difference of 0.020%), Immigrants from Nepal (45.2%, a difference of 0.040%), Immigrants from Portugal (45.2%, a difference of 0.050%), Panamanian (45.2%, a difference of 0.070%), and Immigrants from the Azores (45.2%, a difference of 0.090%).
| Demographics | Rating | Rank | Married-couple Households |
| Cubans | 7.7 /100 | #210 | Tragic 45.4% |
| Immigrants | Spain | 7.3 /100 | #211 | Tragic 45.3% |
| Creek | 6.4 /100 | #212 | Tragic 45.3% |
| Yakama | 5.8 /100 | #213 | Tragic 45.2% |
| Japanese | 5.7 /100 | #214 | Tragic 45.2% |
| Immigrants | Nepal | 5.6 /100 | #215 | Tragic 45.2% |
| Immigrants | Portugal | 5.6 /100 | #216 | Tragic 45.2% |
| Panamanians | 5.5 /100 | #217 | Tragic 45.2% |
| Immigrants | Azores | 5.3 /100 | #218 | Tragic 45.2% |
| Nicaraguans | 5.3 /100 | #219 | Tragic 45.2% |
| Immigrants | Thailand | 5.1 /100 | #220 | Tragic 45.2% |
| Tlingit-Haida | 4.9 /100 | #221 | Tragic 45.1% |
| Immigrants | Laos | 4.6 /100 | #222 | Tragic 45.1% |
| Immigrants | Cambodia | 2.7 /100 | #223 | Tragic 44.9% |
| Immigrants | Micronesia | 2.6 /100 | #224 | Tragic 44.9% |
| Dutch West Indians | 2.6 /100 | #225 | Tragic 44.9% |
| Alsatians | 2.3 /100 | #226 | Tragic 44.8% |
| Salvadorans | 1.9 /100 | #227 | Tragic 44.7% |
| Kenyans | 1.7 /100 | #228 | Tragic 44.7% |
| Immigrants | Latin America | 1.6 /100 | #229 | Tragic 44.7% |
| Soviet Union | 1.6 /100 | #230 | Tragic 44.6% |