Immigrants from Egypt vs Yakama Married-couple Households
COMPARE
Immigrants from Egypt
Yakama
Married-couple Households
Married-couple Households Comparison
Immigrants from Egypt
Yakama
47.9%
MARRIED-COUPLE HOUSEHOLDS
96.6/ 100
METRIC RATING
96th/ 347
METRIC RANK
45.2%
MARRIED-COUPLE HOUSEHOLDS
5.8/ 100
METRIC RATING
213th/ 347
METRIC RANK
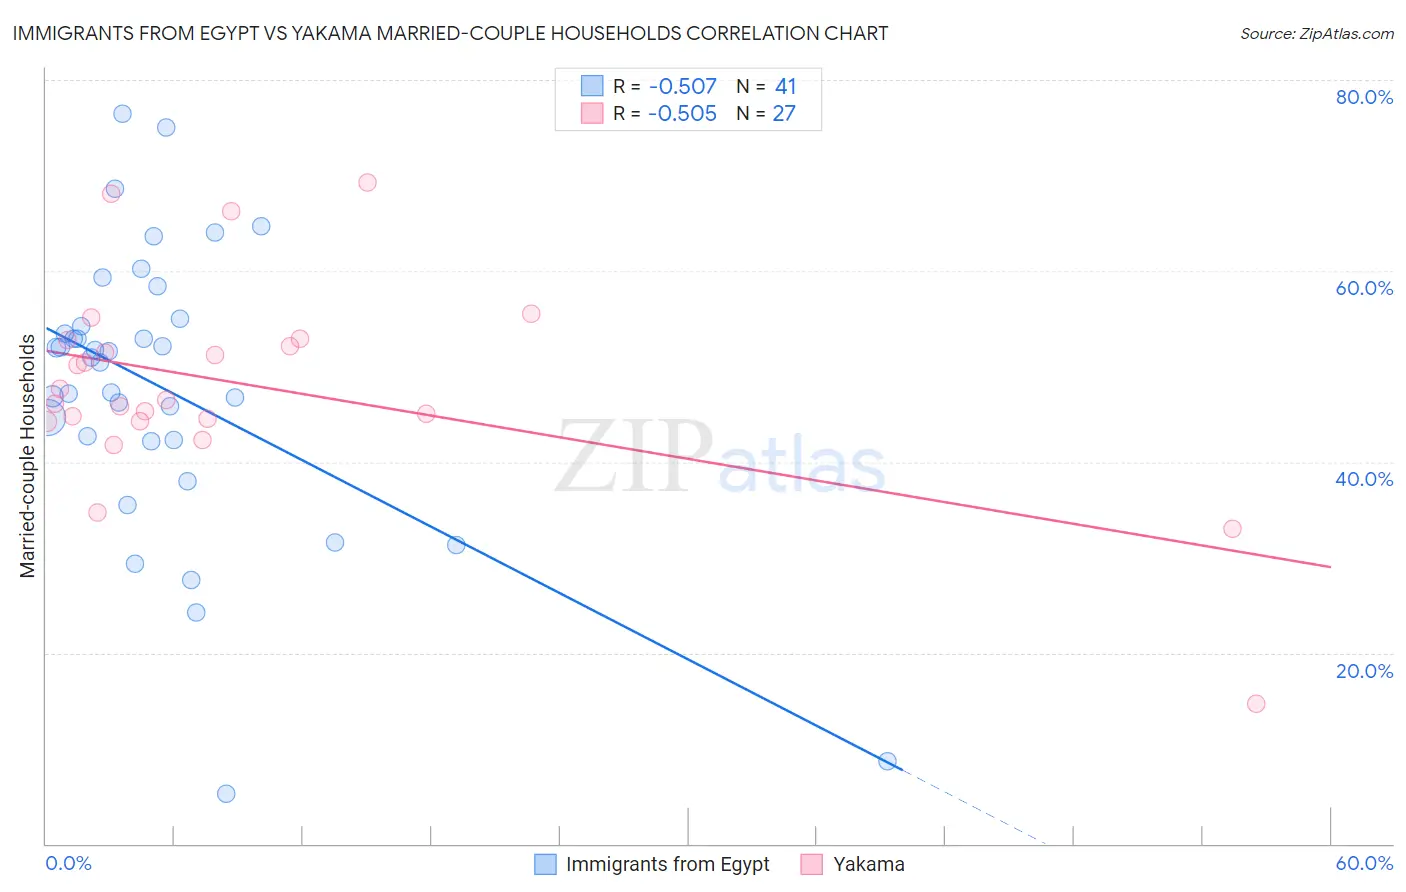
Immigrants from Egypt vs Yakama Married-couple Households Correlation Chart
The statistical analysis conducted on geographies consisting of 245,425,004 people shows a substantial negative correlation between the proportion of Immigrants from Egypt and percentage of married-couple family households in the United States with a correlation coefficient (R) of -0.507 and weighted average of 47.9%. Similarly, the statistical analysis conducted on geographies consisting of 19,917,879 people shows a substantial negative correlation between the proportion of Yakama and percentage of married-couple family households in the United States with a correlation coefficient (R) of -0.505 and weighted average of 45.2%, a difference of 5.9%.
Married-couple Households Correlation Summary
| Measurement | Immigrants from Egypt | Yakama |
| Minimum | 5.3% | 14.7% |
| Maximum | 76.5% | 69.2% |
| Range | 71.2% | 54.6% |
| Mean | 47.7% | 48.0% |
| Median | 51.0% | 46.5% |
| Interquartile 25% (IQ1) | 42.2% | 44.3% |
| Interquartile 75% (IQ3) | 54.6% | 52.8% |
| Interquartile Range (IQR) | 12.3% | 8.5% |
| Standard Deviation (Sample) | 15.0% | 10.8% |
| Standard Deviation (Population) | 14.8% | 10.6% |
Similar Demographics by Married-couple Households
Demographics Similar to Immigrants from Egypt by Married-couple Households
In terms of married-couple households, the demographic groups most similar to Immigrants from Egypt are Latvian (47.9%, a difference of 0.030%), Immigrants from North Macedonia (47.9%, a difference of 0.040%), Immigrants from Belgium (47.9%, a difference of 0.050%), Immigrants from Austria (47.9%, a difference of 0.050%), and Immigrants from Italy (47.9%, a difference of 0.060%).
| Demographics | Rating | Rank | Married-couple Households |
| Cypriots | 97.2 /100 | #89 | Exceptional 48.0% |
| French | 97.2 /100 | #90 | Exceptional 48.0% |
| Immigrants | Moldova | 97.0 /100 | #91 | Exceptional 48.0% |
| Palestinians | 96.9 /100 | #92 | Exceptional 48.0% |
| Lebanese | 96.9 /100 | #93 | Exceptional 47.9% |
| Americans | 96.9 /100 | #94 | Exceptional 47.9% |
| Immigrants | Belgium | 96.8 /100 | #95 | Exceptional 47.9% |
| Immigrants | Egypt | 96.6 /100 | #96 | Exceptional 47.9% |
| Latvians | 96.5 /100 | #97 | Exceptional 47.9% |
| Immigrants | North Macedonia | 96.4 /100 | #98 | Exceptional 47.9% |
| Immigrants | Austria | 96.4 /100 | #99 | Exceptional 47.9% |
| Immigrants | Italy | 96.3 /100 | #100 | Exceptional 47.9% |
| Turks | 96.1 /100 | #101 | Exceptional 47.8% |
| Slavs | 96.0 /100 | #102 | Exceptional 47.8% |
| Hawaiians | 96.0 /100 | #103 | Exceptional 47.8% |
Demographics Similar to Yakama by Married-couple Households
In terms of married-couple households, the demographic groups most similar to Yakama are Japanese (45.2%, a difference of 0.020%), Immigrants from Nepal (45.2%, a difference of 0.040%), Immigrants from Portugal (45.2%, a difference of 0.050%), Panamanian (45.2%, a difference of 0.070%), and Immigrants from the Azores (45.2%, a difference of 0.090%).
| Demographics | Rating | Rank | Married-couple Households |
| Uruguayans | 10.4 /100 | #206 | Poor 45.5% |
| Immigrants | France | 8.8 /100 | #207 | Tragic 45.4% |
| Hispanics or Latinos | 8.7 /100 | #208 | Tragic 45.4% |
| Immigrants | Uzbekistan | 8.4 /100 | #209 | Tragic 45.4% |
| Cubans | 7.7 /100 | #210 | Tragic 45.4% |
| Immigrants | Spain | 7.3 /100 | #211 | Tragic 45.3% |
| Creek | 6.4 /100 | #212 | Tragic 45.3% |
| Yakama | 5.8 /100 | #213 | Tragic 45.2% |
| Japanese | 5.7 /100 | #214 | Tragic 45.2% |
| Immigrants | Nepal | 5.6 /100 | #215 | Tragic 45.2% |
| Immigrants | Portugal | 5.6 /100 | #216 | Tragic 45.2% |
| Panamanians | 5.5 /100 | #217 | Tragic 45.2% |
| Immigrants | Azores | 5.3 /100 | #218 | Tragic 45.2% |
| Nicaraguans | 5.3 /100 | #219 | Tragic 45.2% |
| Immigrants | Thailand | 5.1 /100 | #220 | Tragic 45.2% |