French American Indian vs Yakama Married-couple Households
COMPARE
French American Indian
Yakama
Married-couple Households
Married-couple Households Comparison
French American Indians
Yakama
44.1%
MARRIED-COUPLE HOUSEHOLDS
0.4/ 100
METRIC RATING
250th/ 347
METRIC RANK
45.2%
MARRIED-COUPLE HOUSEHOLDS
5.8/ 100
METRIC RATING
213th/ 347
METRIC RANK
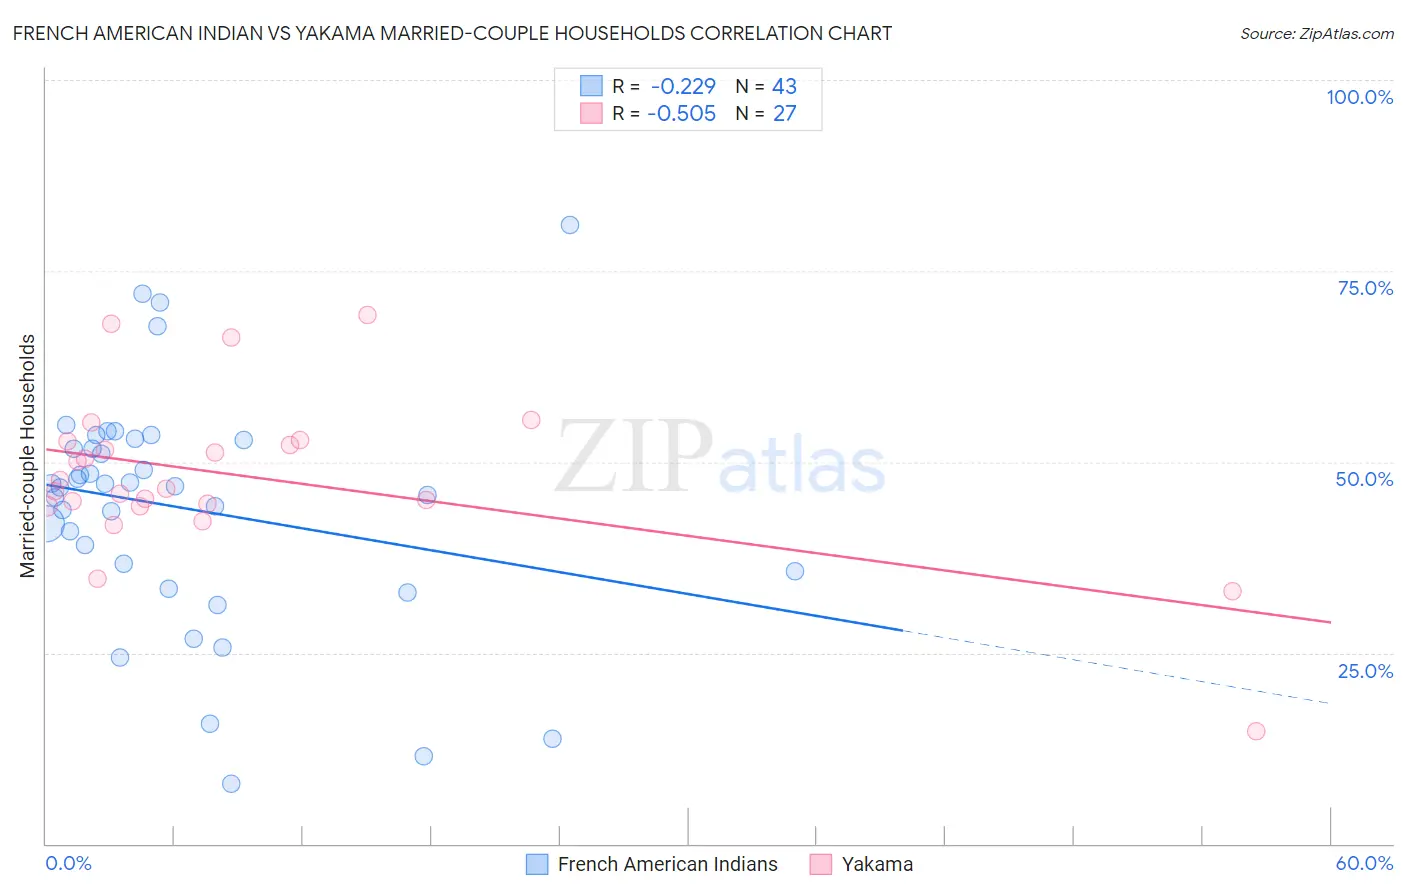
French American Indian vs Yakama Married-couple Households Correlation Chart
The statistical analysis conducted on geographies consisting of 131,960,385 people shows a weak negative correlation between the proportion of French American Indians and percentage of married-couple family households in the United States with a correlation coefficient (R) of -0.229 and weighted average of 44.1%. Similarly, the statistical analysis conducted on geographies consisting of 19,917,879 people shows a substantial negative correlation between the proportion of Yakama and percentage of married-couple family households in the United States with a correlation coefficient (R) of -0.505 and weighted average of 45.2%, a difference of 2.7%.
Married-couple Households Correlation Summary
| Measurement | French American Indian | Yakama |
| Minimum | 7.9% | 14.7% |
| Maximum | 81.0% | 69.2% |
| Range | 73.1% | 54.6% |
| Mean | 44.0% | 48.0% |
| Median | 46.8% | 46.5% |
| Interquartile 25% (IQ1) | 35.7% | 44.3% |
| Interquartile 75% (IQ3) | 52.8% | 52.8% |
| Interquartile Range (IQR) | 17.1% | 8.5% |
| Standard Deviation (Sample) | 15.5% | 10.8% |
| Standard Deviation (Population) | 15.3% | 10.6% |
Similar Demographics by Married-couple Households
Demographics Similar to French American Indians by Married-couple Households
In terms of married-couple households, the demographic groups most similar to French American Indians are Immigrants from Kenya (44.1%, a difference of 0.010%), Yup'ik (44.1%, a difference of 0.050%), German Russian (44.0%, a difference of 0.080%), Seminole (44.0%, a difference of 0.15%), and Central American (43.9%, a difference of 0.27%).
| Demographics | Rating | Rank | Married-couple Households |
| Immigrants | Saudi Arabia | 0.9 /100 | #243 | Tragic 44.4% |
| Immigrants | Armenia | 0.7 /100 | #244 | Tragic 44.3% |
| Immigrants | El Salvador | 0.7 /100 | #245 | Tragic 44.3% |
| Immigrants | Cuba | 0.6 /100 | #246 | Tragic 44.2% |
| Immigrants | Morocco | 0.6 /100 | #247 | Tragic 44.2% |
| Yup'ik | 0.4 /100 | #248 | Tragic 44.1% |
| Immigrants | Kenya | 0.4 /100 | #249 | Tragic 44.1% |
| French American Indians | 0.4 /100 | #250 | Tragic 44.1% |
| German Russians | 0.4 /100 | #251 | Tragic 44.0% |
| Seminole | 0.4 /100 | #252 | Tragic 44.0% |
| Central Americans | 0.3 /100 | #253 | Tragic 43.9% |
| Apache | 0.3 /100 | #254 | Tragic 43.9% |
| Shoshone | 0.3 /100 | #255 | Tragic 43.9% |
| Ugandans | 0.3 /100 | #256 | Tragic 43.8% |
| Blackfeet | 0.2 /100 | #257 | Tragic 43.8% |
Demographics Similar to Yakama by Married-couple Households
In terms of married-couple households, the demographic groups most similar to Yakama are Japanese (45.2%, a difference of 0.020%), Immigrants from Nepal (45.2%, a difference of 0.040%), Immigrants from Portugal (45.2%, a difference of 0.050%), Panamanian (45.2%, a difference of 0.070%), and Immigrants from the Azores (45.2%, a difference of 0.090%).
| Demographics | Rating | Rank | Married-couple Households |
| Uruguayans | 10.4 /100 | #206 | Poor 45.5% |
| Immigrants | France | 8.8 /100 | #207 | Tragic 45.4% |
| Hispanics or Latinos | 8.7 /100 | #208 | Tragic 45.4% |
| Immigrants | Uzbekistan | 8.4 /100 | #209 | Tragic 45.4% |
| Cubans | 7.7 /100 | #210 | Tragic 45.4% |
| Immigrants | Spain | 7.3 /100 | #211 | Tragic 45.3% |
| Creek | 6.4 /100 | #212 | Tragic 45.3% |
| Yakama | 5.8 /100 | #213 | Tragic 45.2% |
| Japanese | 5.7 /100 | #214 | Tragic 45.2% |
| Immigrants | Nepal | 5.6 /100 | #215 | Tragic 45.2% |
| Immigrants | Portugal | 5.6 /100 | #216 | Tragic 45.2% |
| Panamanians | 5.5 /100 | #217 | Tragic 45.2% |
| Immigrants | Azores | 5.3 /100 | #218 | Tragic 45.2% |
| Nicaraguans | 5.3 /100 | #219 | Tragic 45.2% |
| Immigrants | Thailand | 5.1 /100 | #220 | Tragic 45.2% |