Maltese vs Barbadian Married-couple Households
COMPARE
Maltese
Barbadian
Married-couple Households
Married-couple Households Comparison
Maltese
Barbadians
49.2%
MARRIED-COUPLE HOUSEHOLDS
99.8/ 100
METRIC RATING
29th/ 347
METRIC RANK
39.4%
MARRIED-COUPLE HOUSEHOLDS
0.0/ 100
METRIC RATING
328th/ 347
METRIC RANK
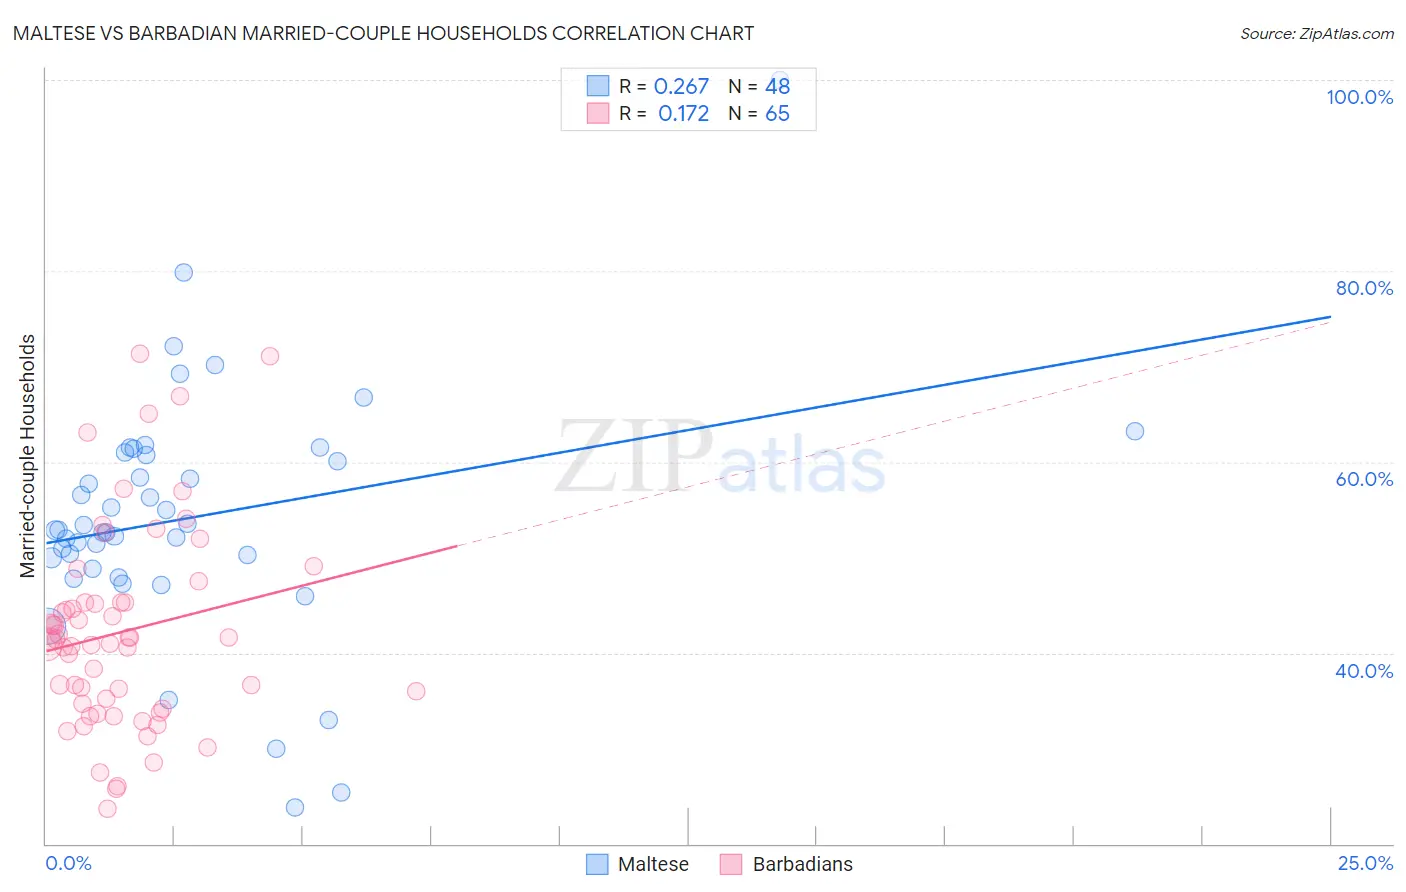
Maltese vs Barbadian Married-couple Households Correlation Chart
The statistical analysis conducted on geographies consisting of 126,420,925 people shows a weak positive correlation between the proportion of Maltese and percentage of married-couple family households in the United States with a correlation coefficient (R) of 0.267 and weighted average of 49.2%. Similarly, the statistical analysis conducted on geographies consisting of 141,274,787 people shows a poor positive correlation between the proportion of Barbadians and percentage of married-couple family households in the United States with a correlation coefficient (R) of 0.172 and weighted average of 39.4%, a difference of 24.8%.
Married-couple Households Correlation Summary
| Measurement | Maltese | Barbadian |
| Minimum | 23.8% | 23.7% |
| Maximum | 100.0% | 71.4% |
| Range | 76.2% | 47.7% |
| Mean | 54.2% | 42.2% |
| Median | 52.9% | 41.4% |
| Interquartile 25% (IQ1) | 49.4% | 34.4% |
| Interquartile 75% (IQ3) | 60.8% | 45.3% |
| Interquartile Range (IQR) | 11.5% | 10.9% |
| Standard Deviation (Sample) | 12.9% | 10.5% |
| Standard Deviation (Population) | 12.8% | 10.5% |
Similar Demographics by Married-couple Households
Demographics Similar to Maltese by Married-couple Households
In terms of married-couple households, the demographic groups most similar to Maltese are German (49.2%, a difference of 0.010%), Bolivian (49.2%, a difference of 0.020%), Native Hawaiian (49.1%, a difference of 0.12%), Hungarian (49.1%, a difference of 0.18%), and Bhutanese (49.3%, a difference of 0.20%).
| Demographics | Rating | Rank | Married-couple Households |
| Asians | 99.9 /100 | #22 | Exceptional 49.5% |
| Dutch | 99.9 /100 | #23 | Exceptional 49.5% |
| Czechs | 99.9 /100 | #24 | Exceptional 49.4% |
| Immigrants | Philippines | 99.9 /100 | #25 | Exceptional 49.3% |
| Immigrants | Scotland | 99.8 /100 | #26 | Exceptional 49.3% |
| Bhutanese | 99.8 /100 | #27 | Exceptional 49.3% |
| Germans | 99.8 /100 | #28 | Exceptional 49.2% |
| Maltese | 99.8 /100 | #29 | Exceptional 49.2% |
| Bolivians | 99.8 /100 | #30 | Exceptional 49.2% |
| Native Hawaiians | 99.8 /100 | #31 | Exceptional 49.1% |
| Hungarians | 99.8 /100 | #32 | Exceptional 49.1% |
| Immigrants | Asia | 99.7 /100 | #33 | Exceptional 49.1% |
| Italians | 99.7 /100 | #34 | Exceptional 49.0% |
| Scottish | 99.7 /100 | #35 | Exceptional 49.0% |
| Iranians | 99.7 /100 | #36 | Exceptional 49.0% |
Demographics Similar to Barbadians by Married-couple Households
In terms of married-couple households, the demographic groups most similar to Barbadians are Immigrants from Dominica (39.4%, a difference of 0.080%), Lumbee (39.6%, a difference of 0.50%), Immigrants from Barbados (39.2%, a difference of 0.52%), Immigrants from Congo (39.0%, a difference of 0.95%), and U.S. Virgin Islander (39.8%, a difference of 0.97%).
| Demographics | Rating | Rank | Married-couple Households |
| Immigrants | Liberia | 0.0 /100 | #321 | Tragic 40.3% |
| Immigrants | Zaire | 0.0 /100 | #322 | Tragic 40.1% |
| Puerto Ricans | 0.0 /100 | #323 | Tragic 40.1% |
| Navajo | 0.0 /100 | #324 | Tragic 40.1% |
| Pueblo | 0.0 /100 | #325 | Tragic 40.0% |
| U.S. Virgin Islanders | 0.0 /100 | #326 | Tragic 39.8% |
| Lumbee | 0.0 /100 | #327 | Tragic 39.6% |
| Barbadians | 0.0 /100 | #328 | Tragic 39.4% |
| Immigrants | Dominica | 0.0 /100 | #329 | Tragic 39.4% |
| Immigrants | Barbados | 0.0 /100 | #330 | Tragic 39.2% |
| Immigrants | Congo | 0.0 /100 | #331 | Tragic 39.0% |
| Somalis | 0.0 /100 | #332 | Tragic 39.0% |
| Immigrants | West Indies | 0.0 /100 | #333 | Tragic 39.0% |
| Immigrants | St. Vincent and the Grenadines | 0.0 /100 | #334 | Tragic 38.7% |
| Senegalese | 0.0 /100 | #335 | Tragic 38.6% |