Lumbee vs Immigrants from China Single Father Households
COMPARE
Lumbee
Immigrants from China
Single Father Households
Single Father Households Comparison
Lumbee
Immigrants from China
2.8%
SINGLE FATHER HOUSEHOLDS
0.0/ 100
METRIC RATING
299th/ 347
METRIC RANK
1.8%
SINGLE FATHER HOUSEHOLDS
100.0/ 100
METRIC RATING
9th/ 347
METRIC RANK
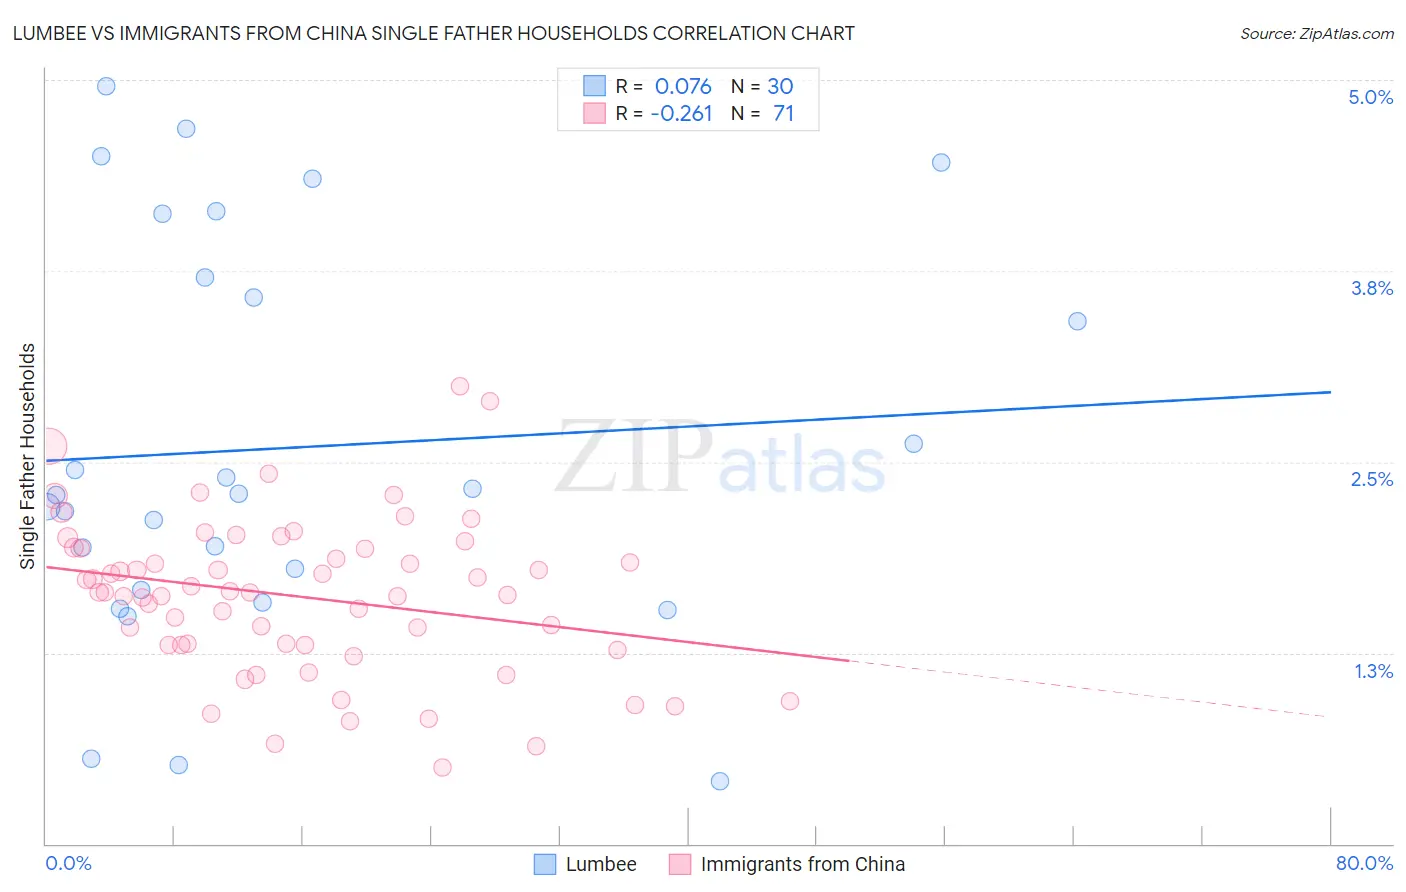
Lumbee vs Immigrants from China Single Father Households Correlation Chart
The statistical analysis conducted on geographies consisting of 91,890,411 people shows a slight positive correlation between the proportion of Lumbee and percentage of single father households in the United States with a correlation coefficient (R) of 0.076 and weighted average of 2.8%. Similarly, the statistical analysis conducted on geographies consisting of 451,618,503 people shows a weak negative correlation between the proportion of Immigrants from China and percentage of single father households in the United States with a correlation coefficient (R) of -0.261 and weighted average of 1.8%, a difference of 50.5%.
Single Father Households Correlation Summary
| Measurement | Lumbee | Immigrants from China |
| Minimum | 0.41% | 0.50% |
| Maximum | 5.0% | 3.0% |
| Range | 4.5% | 2.5% |
| Mean | 2.6% | 1.6% |
| Median | 2.3% | 1.6% |
| Interquartile 25% (IQ1) | 1.7% | 1.3% |
| Interquartile 75% (IQ3) | 3.7% | 1.9% |
| Interquartile Range (IQR) | 2.0% | 0.63% |
| Standard Deviation (Sample) | 1.3% | 0.51% |
| Standard Deviation (Population) | 1.3% | 0.50% |
Similar Demographics by Single Father Households
Demographics Similar to Lumbee by Single Father Households
In terms of single father households, the demographic groups most similar to Lumbee are Cree (2.8%, a difference of 0.38%), Kiowa (2.8%, a difference of 0.40%), Immigrants from Latin America (2.8%, a difference of 0.45%), Honduran (2.8%, a difference of 0.87%), and Japanese (2.8%, a difference of 0.95%).
| Demographics | Rating | Rank | Single Father Households |
| Choctaw | 0.0 /100 | #292 | Tragic 2.7% |
| Immigrants | Fiji | 0.0 /100 | #293 | Tragic 2.7% |
| Malaysians | 0.0 /100 | #294 | Tragic 2.7% |
| Chickasaw | 0.0 /100 | #295 | Tragic 2.8% |
| Japanese | 0.0 /100 | #296 | Tragic 2.8% |
| Hondurans | 0.0 /100 | #297 | Tragic 2.8% |
| Cree | 0.0 /100 | #298 | Tragic 2.8% |
| Lumbee | 0.0 /100 | #299 | Tragic 2.8% |
| Kiowa | 0.0 /100 | #300 | Tragic 2.8% |
| Immigrants | Latin America | 0.0 /100 | #301 | Tragic 2.8% |
| Spanish Americans | 0.0 /100 | #302 | Tragic 2.8% |
| Immigrants | Honduras | 0.0 /100 | #303 | Tragic 2.8% |
| Mexican American Indians | 0.0 /100 | #304 | Tragic 2.8% |
| Hispanics or Latinos | 0.0 /100 | #305 | Tragic 2.8% |
| Immigrants | Azores | 0.0 /100 | #306 | Tragic 2.8% |
Demographics Similar to Immigrants from China by Single Father Households
In terms of single father households, the demographic groups most similar to Immigrants from China are Immigrants from Ireland (1.8%, a difference of 0.14%), Cypriot (1.8%, a difference of 0.25%), Okinawan (1.9%, a difference of 0.36%), Immigrants from Taiwan (1.8%, a difference of 0.40%), and Immigrants from Belarus (1.9%, a difference of 0.68%).
| Demographics | Rating | Rank | Single Father Households |
| Immigrants | Israel | 100.0 /100 | #2 | Exceptional 1.8% |
| Filipinos | 100.0 /100 | #3 | Exceptional 1.8% |
| Immigrants | Uzbekistan | 100.0 /100 | #4 | Exceptional 1.8% |
| Immigrants | Hong Kong | 100.0 /100 | #5 | Exceptional 1.8% |
| Immigrants | Taiwan | 100.0 /100 | #6 | Exceptional 1.8% |
| Cypriots | 100.0 /100 | #7 | Exceptional 1.8% |
| Immigrants | Ireland | 100.0 /100 | #8 | Exceptional 1.8% |
| Immigrants | China | 100.0 /100 | #9 | Exceptional 1.8% |
| Okinawans | 100.0 /100 | #10 | Exceptional 1.9% |
| Immigrants | Belarus | 100.0 /100 | #11 | Exceptional 1.9% |
| Immigrants | Greece | 100.0 /100 | #12 | Exceptional 1.9% |
| Immigrants | Singapore | 100.0 /100 | #13 | Exceptional 1.9% |
| Immigrants | Lithuania | 100.0 /100 | #14 | Exceptional 1.9% |
| Immigrants | Eastern Asia | 100.0 /100 | #15 | Exceptional 1.9% |
| Immigrants | Iran | 100.0 /100 | #16 | Exceptional 1.9% |