Lumbee vs Immigrants from Yemen Single Father Households
COMPARE
Lumbee
Immigrants from Yemen
Single Father Households
Single Father Households Comparison
Lumbee
Immigrants from Yemen
2.8%
SINGLE FATHER HOUSEHOLDS
0.0/ 100
METRIC RATING
299th/ 347
METRIC RANK
2.2%
SINGLE FATHER HOUSEHOLDS
97.5/ 100
METRIC RATING
123rd/ 347
METRIC RANK
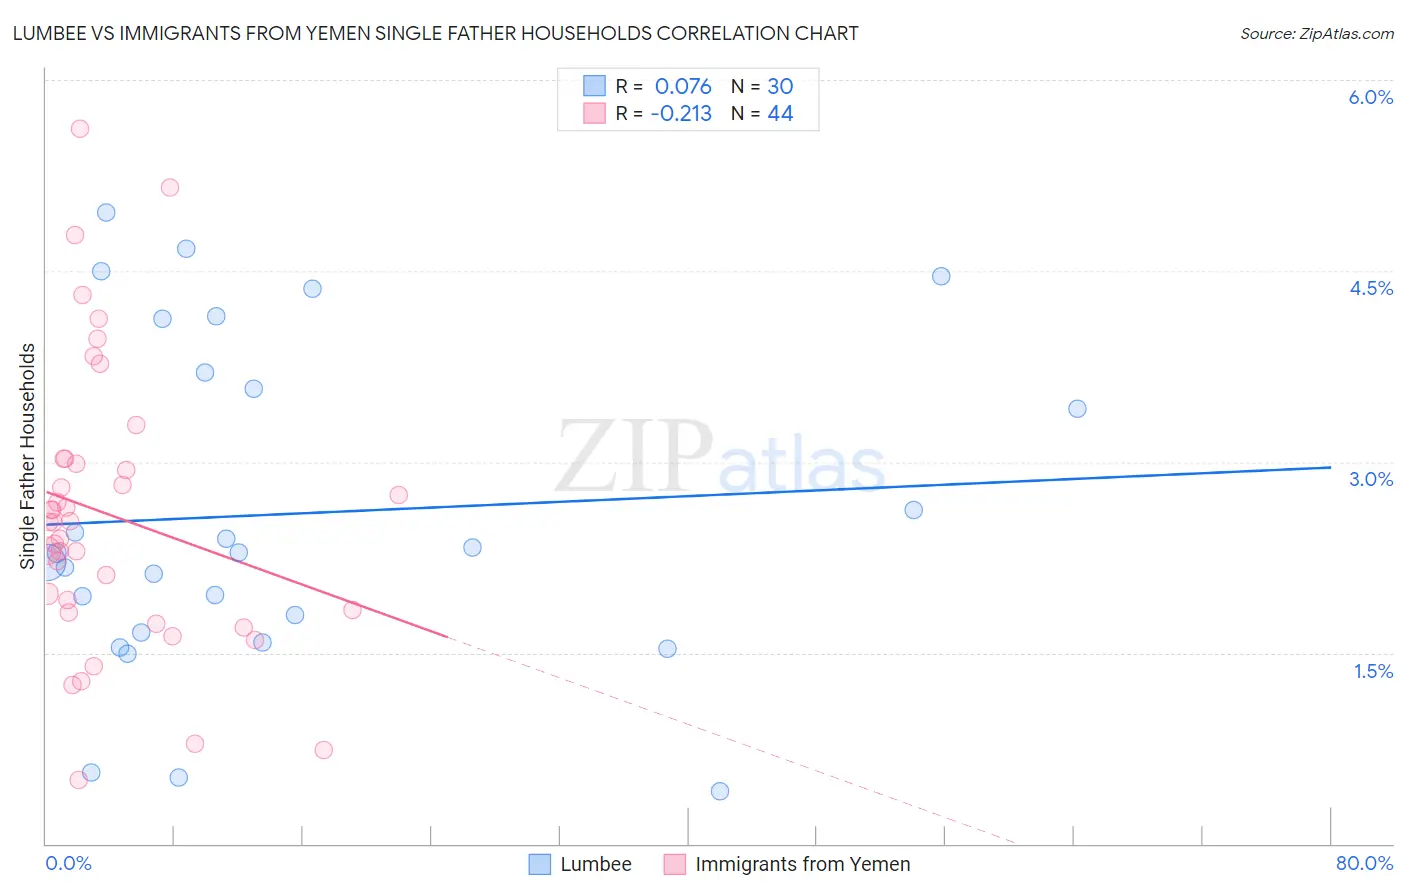
Lumbee vs Immigrants from Yemen Single Father Households Correlation Chart
The statistical analysis conducted on geographies consisting of 91,890,411 people shows a slight positive correlation between the proportion of Lumbee and percentage of single father households in the United States with a correlation coefficient (R) of 0.076 and weighted average of 2.8%. Similarly, the statistical analysis conducted on geographies consisting of 82,364,844 people shows a weak negative correlation between the proportion of Immigrants from Yemen and percentage of single father households in the United States with a correlation coefficient (R) of -0.213 and weighted average of 2.2%, a difference of 27.4%.
Single Father Households Correlation Summary
| Measurement | Lumbee | Immigrants from Yemen |
| Minimum | 0.41% | 0.50% |
| Maximum | 5.0% | 5.6% |
| Range | 4.5% | 5.1% |
| Mean | 2.6% | 2.6% |
| Median | 2.3% | 2.5% |
| Interquartile 25% (IQ1) | 1.7% | 1.8% |
| Interquartile 75% (IQ3) | 3.7% | 3.0% |
| Interquartile Range (IQR) | 2.0% | 1.2% |
| Standard Deviation (Sample) | 1.3% | 1.1% |
| Standard Deviation (Population) | 1.3% | 1.1% |
Similar Demographics by Single Father Households
Demographics Similar to Lumbee by Single Father Households
In terms of single father households, the demographic groups most similar to Lumbee are Cree (2.8%, a difference of 0.38%), Kiowa (2.8%, a difference of 0.40%), Immigrants from Latin America (2.8%, a difference of 0.45%), Honduran (2.8%, a difference of 0.87%), and Japanese (2.8%, a difference of 0.95%).
| Demographics | Rating | Rank | Single Father Households |
| Choctaw | 0.0 /100 | #292 | Tragic 2.7% |
| Immigrants | Fiji | 0.0 /100 | #293 | Tragic 2.7% |
| Malaysians | 0.0 /100 | #294 | Tragic 2.7% |
| Chickasaw | 0.0 /100 | #295 | Tragic 2.8% |
| Japanese | 0.0 /100 | #296 | Tragic 2.8% |
| Hondurans | 0.0 /100 | #297 | Tragic 2.8% |
| Cree | 0.0 /100 | #298 | Tragic 2.8% |
| Lumbee | 0.0 /100 | #299 | Tragic 2.8% |
| Kiowa | 0.0 /100 | #300 | Tragic 2.8% |
| Immigrants | Latin America | 0.0 /100 | #301 | Tragic 2.8% |
| Spanish Americans | 0.0 /100 | #302 | Tragic 2.8% |
| Immigrants | Honduras | 0.0 /100 | #303 | Tragic 2.8% |
| Mexican American Indians | 0.0 /100 | #304 | Tragic 2.8% |
| Hispanics or Latinos | 0.0 /100 | #305 | Tragic 2.8% |
| Immigrants | Azores | 0.0 /100 | #306 | Tragic 2.8% |
Demographics Similar to Immigrants from Yemen by Single Father Households
In terms of single father households, the demographic groups most similar to Immigrants from Yemen are British West Indian (2.2%, a difference of 0.020%), Immigrants from Indonesia (2.2%, a difference of 0.070%), Immigrants from Iraq (2.2%, a difference of 0.15%), Australian (2.2%, a difference of 0.25%), and Immigrants from Brazil (2.2%, a difference of 0.25%).
| Demographics | Rating | Rank | Single Father Households |
| Immigrants | Argentina | 98.1 /100 | #116 | Exceptional 2.2% |
| Hungarians | 97.9 /100 | #117 | Exceptional 2.2% |
| Immigrants | Morocco | 97.8 /100 | #118 | Exceptional 2.2% |
| Trinidadians and Tobagonians | 97.8 /100 | #119 | Exceptional 2.2% |
| Australians | 97.7 /100 | #120 | Exceptional 2.2% |
| Immigrants | Brazil | 97.7 /100 | #121 | Exceptional 2.2% |
| Immigrants | Iraq | 97.6 /100 | #122 | Exceptional 2.2% |
| Immigrants | Yemen | 97.5 /100 | #123 | Exceptional 2.2% |
| British West Indians | 97.4 /100 | #124 | Exceptional 2.2% |
| Immigrants | Indonesia | 97.4 /100 | #125 | Exceptional 2.2% |
| Moroccans | 96.9 /100 | #126 | Exceptional 2.2% |
| Jordanians | 96.9 /100 | #127 | Exceptional 2.2% |
| Immigrants | England | 96.8 /100 | #128 | Exceptional 2.2% |
| Serbians | 96.8 /100 | #129 | Exceptional 2.2% |
| Immigrants | Chile | 96.7 /100 | #130 | Exceptional 2.2% |