Marshallese vs Palestinian Single Father Households
COMPARE
Marshallese
Palestinian
Single Father Households
Single Father Households Comparison
Marshallese
Palestinians
2.4%
SINGLE FATHER HOUSEHOLDS
9.7/ 100
METRIC RATING
225th/ 347
METRIC RANK
2.2%
SINGLE FATHER HOUSEHOLDS
98.6/ 100
METRIC RATING
105th/ 347
METRIC RANK
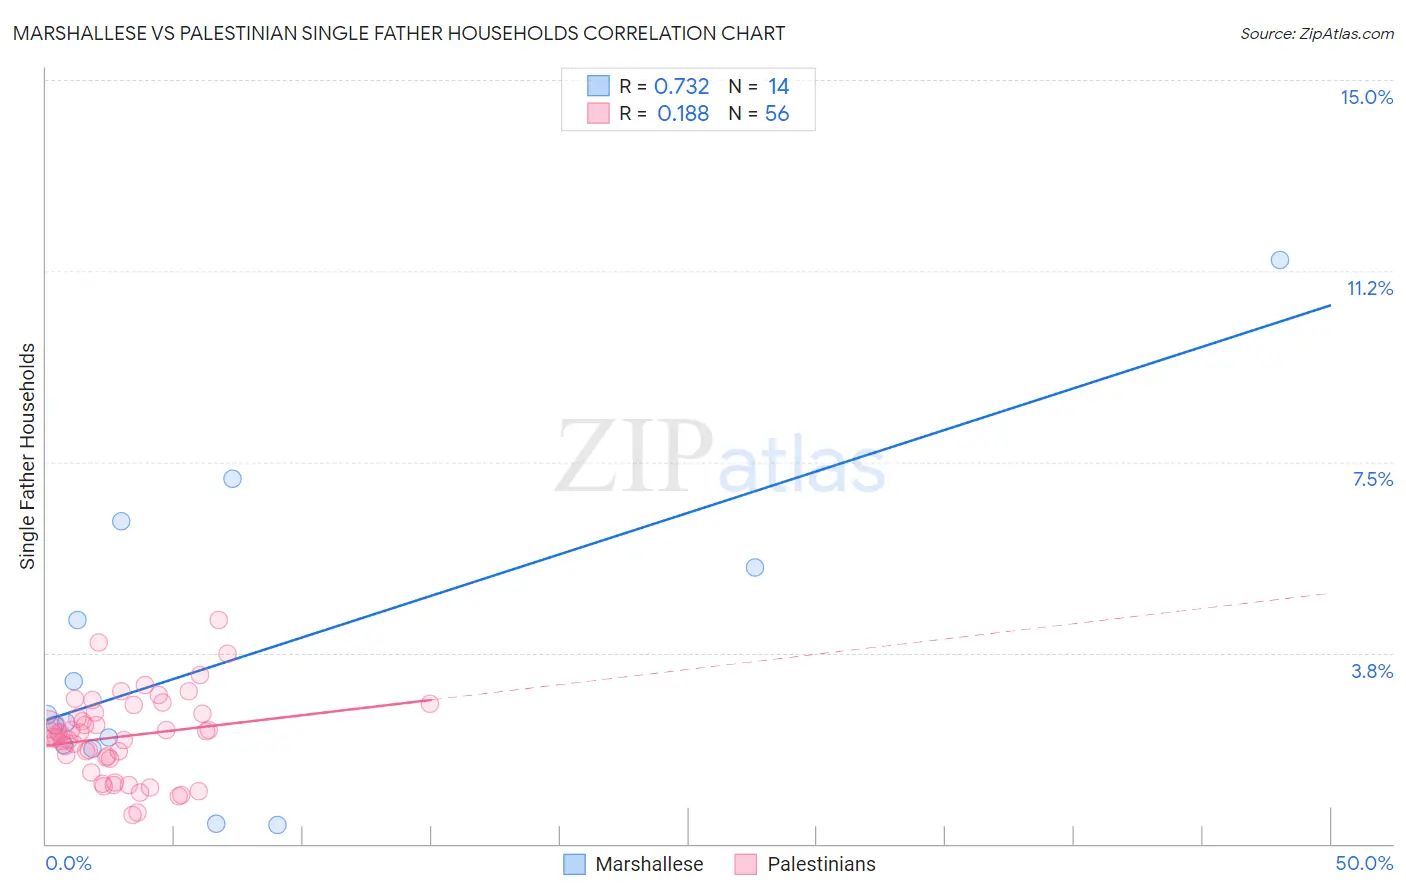
Marshallese vs Palestinian Single Father Households Correlation Chart
The statistical analysis conducted on geographies consisting of 14,759,622 people shows a strong positive correlation between the proportion of Marshallese and percentage of single father households in the United States with a correlation coefficient (R) of 0.732 and weighted average of 2.4%. Similarly, the statistical analysis conducted on geographies consisting of 215,869,880 people shows a poor positive correlation between the proportion of Palestinians and percentage of single father households in the United States with a correlation coefficient (R) of 0.188 and weighted average of 2.2%, a difference of 13.0%.
Single Father Households Correlation Summary
| Measurement | Marshallese | Palestinian |
| Minimum | 0.37% | 0.57% |
| Maximum | 11.5% | 4.4% |
| Range | 11.1% | 3.8% |
| Mean | 3.7% | 2.1% |
| Median | 2.5% | 2.2% |
| Interquartile 25% (IQ1) | 1.9% | 1.7% |
| Interquartile 75% (IQ3) | 5.4% | 2.6% |
| Interquartile Range (IQR) | 3.5% | 0.88% |
| Standard Deviation (Sample) | 3.0% | 0.81% |
| Standard Deviation (Population) | 2.9% | 0.80% |
Similar Demographics by Single Father Households
Demographics Similar to Marshallese by Single Father Households
In terms of single father households, the demographic groups most similar to Marshallese are Black/African American (2.4%, a difference of 0.010%), American (2.4%, a difference of 0.080%), Immigrants from Ghana (2.4%, a difference of 0.12%), Immigrants from Bahamas (2.4%, a difference of 0.17%), and Immigrants from Zaire (2.4%, a difference of 0.23%).
| Demographics | Rating | Rank | Single Father Households |
| Immigrants | Ethiopia | 13.4 /100 | #218 | Poor 2.4% |
| Sudanese | 13.0 /100 | #219 | Poor 2.4% |
| Ghanaians | 12.9 /100 | #220 | Poor 2.4% |
| Immigrants | Burma/Myanmar | 12.1 /100 | #221 | Poor 2.4% |
| Immigrants | Eastern Africa | 11.9 /100 | #222 | Poor 2.4% |
| Immigrants | Uruguay | 11.0 /100 | #223 | Poor 2.4% |
| Immigrants | Bahamas | 10.6 /100 | #224 | Poor 2.4% |
| Marshallese | 9.7 /100 | #225 | Tragic 2.4% |
| Blacks/African Americans | 9.7 /100 | #226 | Tragic 2.4% |
| Americans | 9.3 /100 | #227 | Tragic 2.4% |
| Immigrants | Ghana | 9.1 /100 | #228 | Tragic 2.4% |
| Immigrants | Zaire | 8.6 /100 | #229 | Tragic 2.4% |
| Sub-Saharan Africans | 8.3 /100 | #230 | Tragic 2.4% |
| Immigrants | Nonimmigrants | 7.6 /100 | #231 | Tragic 2.4% |
| Pennsylvania Germans | 7.3 /100 | #232 | Tragic 2.4% |
Demographics Similar to Palestinians by Single Father Households
In terms of single father households, the demographic groups most similar to Palestinians are Immigrants from Southern Europe (2.2%, a difference of 0.11%), Slovene (2.2%, a difference of 0.23%), Immigrants from Netherlands (2.2%, a difference of 0.25%), Barbadian (2.2%, a difference of 0.29%), and Alsatian (2.1%, a difference of 0.37%).
| Demographics | Rating | Rank | Single Father Households |
| Guyanese | 99.1 /100 | #98 | Exceptional 2.1% |
| South Africans | 99.1 /100 | #99 | Exceptional 2.1% |
| Immigrants | Northern Africa | 99.0 /100 | #100 | Exceptional 2.1% |
| Immigrants | Western Europe | 98.9 /100 | #101 | Exceptional 2.1% |
| Argentineans | 98.9 /100 | #102 | Exceptional 2.1% |
| Lebanese | 98.9 /100 | #103 | Exceptional 2.1% |
| Alsatians | 98.9 /100 | #104 | Exceptional 2.1% |
| Palestinians | 98.6 /100 | #105 | Exceptional 2.2% |
| Immigrants | Southern Europe | 98.6 /100 | #106 | Exceptional 2.2% |
| Slovenes | 98.5 /100 | #107 | Exceptional 2.2% |
| Immigrants | Netherlands | 98.5 /100 | #108 | Exceptional 2.2% |
| Barbadians | 98.4 /100 | #109 | Exceptional 2.2% |
| Italians | 98.3 /100 | #110 | Exceptional 2.2% |
| Immigrants | Canada | 98.3 /100 | #111 | Exceptional 2.2% |
| Immigrants | Trinidad and Tobago | 98.2 /100 | #112 | Exceptional 2.2% |