English vs Palestinian Single Father Households
COMPARE
English
Palestinian
Single Father Households
Single Father Households Comparison
English
Palestinians
2.3%
SINGLE FATHER HOUSEHOLDS
68.6/ 100
METRIC RATING
166th/ 347
METRIC RANK
2.2%
SINGLE FATHER HOUSEHOLDS
98.6/ 100
METRIC RATING
105th/ 347
METRIC RANK
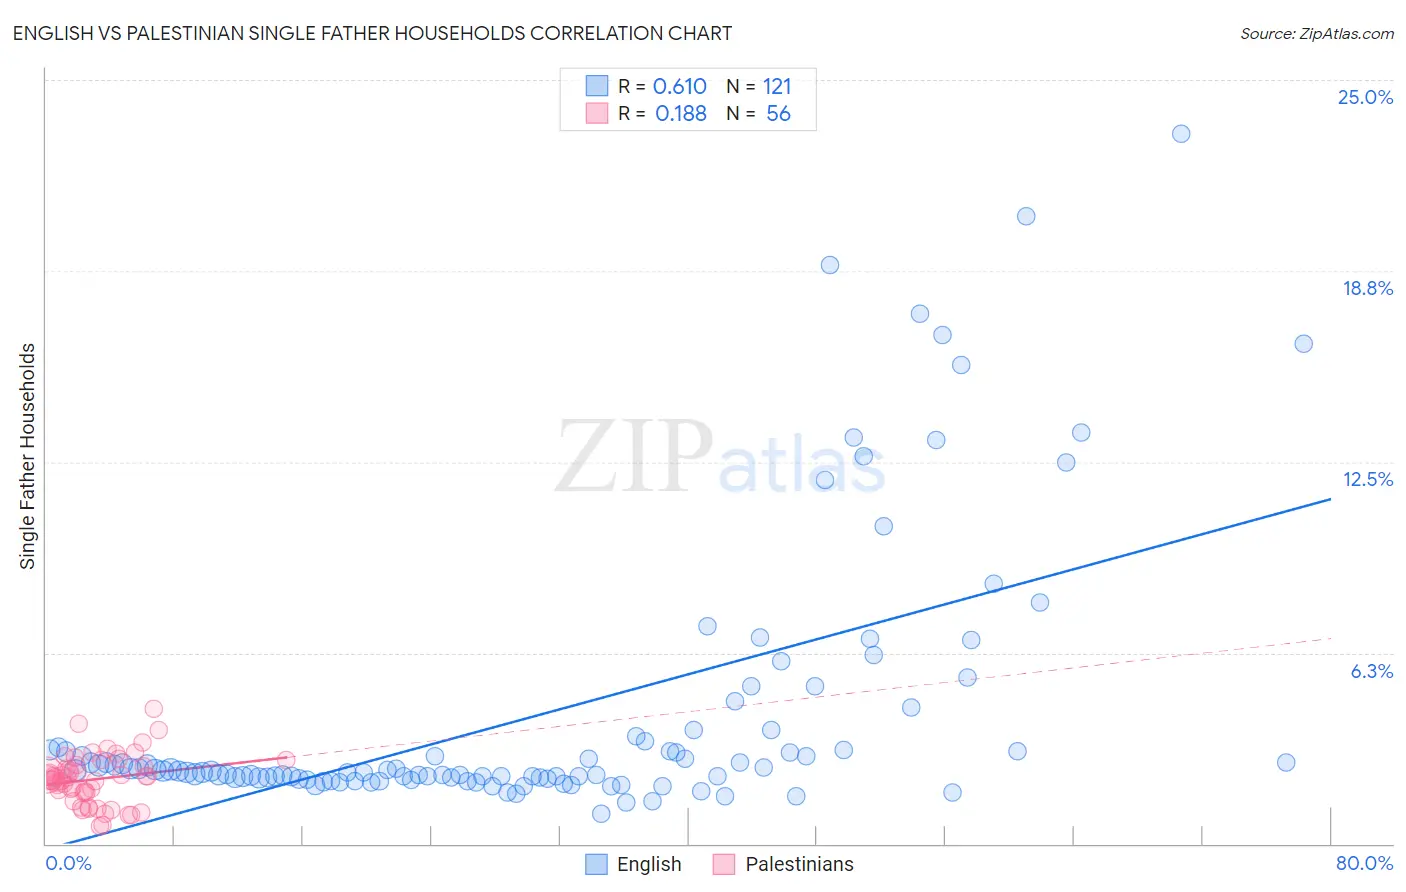
English vs Palestinian Single Father Households Correlation Chart
The statistical analysis conducted on geographies consisting of 561,704,434 people shows a significant positive correlation between the proportion of English and percentage of single father households in the United States with a correlation coefficient (R) of 0.610 and weighted average of 2.3%. Similarly, the statistical analysis conducted on geographies consisting of 215,869,880 people shows a poor positive correlation between the proportion of Palestinians and percentage of single father households in the United States with a correlation coefficient (R) of 0.188 and weighted average of 2.2%, a difference of 7.0%.
Single Father Households Correlation Summary
| Measurement | English | Palestinian |
| Minimum | 0.99% | 0.57% |
| Maximum | 23.3% | 4.4% |
| Range | 22.3% | 3.8% |
| Mean | 4.3% | 2.1% |
| Median | 2.4% | 2.2% |
| Interquartile 25% (IQ1) | 2.2% | 1.7% |
| Interquartile 75% (IQ3) | 3.4% | 2.6% |
| Interquartile Range (IQR) | 1.3% | 0.88% |
| Standard Deviation (Sample) | 4.4% | 0.81% |
| Standard Deviation (Population) | 4.4% | 0.80% |
Similar Demographics by Single Father Households
Demographics Similar to English by Single Father Households
In terms of single father households, the demographic groups most similar to English are Scotch-Irish (2.3%, a difference of 0.070%), Pakistani (2.3%, a difference of 0.17%), Irish (2.3%, a difference of 0.31%), South American (2.3%, a difference of 0.36%), and Scottish (2.3%, a difference of 0.38%).
| Demographics | Rating | Rank | Single Father Households |
| Immigrants | West Indies | 77.9 /100 | #159 | Good 2.3% |
| Immigrants | Bolivia | 76.3 /100 | #160 | Good 2.3% |
| Swiss | 73.2 /100 | #161 | Good 2.3% |
| Scottish | 72.8 /100 | #162 | Good 2.3% |
| Irish | 72.1 /100 | #163 | Good 2.3% |
| Pakistanis | 70.6 /100 | #164 | Good 2.3% |
| Scotch-Irish | 69.4 /100 | #165 | Good 2.3% |
| English | 68.6 /100 | #166 | Good 2.3% |
| South Americans | 64.3 /100 | #167 | Good 2.3% |
| Icelanders | 63.1 /100 | #168 | Good 2.3% |
| Czechs | 62.5 /100 | #169 | Good 2.3% |
| Ugandans | 62.2 /100 | #170 | Good 2.3% |
| Swedes | 61.6 /100 | #171 | Good 2.3% |
| Czechoslovakians | 58.9 /100 | #172 | Average 2.3% |
| Celtics | 55.4 /100 | #173 | Average 2.3% |
Demographics Similar to Palestinians by Single Father Households
In terms of single father households, the demographic groups most similar to Palestinians are Immigrants from Southern Europe (2.2%, a difference of 0.11%), Slovene (2.2%, a difference of 0.23%), Immigrants from Netherlands (2.2%, a difference of 0.25%), Barbadian (2.2%, a difference of 0.29%), and Alsatian (2.1%, a difference of 0.37%).
| Demographics | Rating | Rank | Single Father Households |
| Guyanese | 99.1 /100 | #98 | Exceptional 2.1% |
| South Africans | 99.1 /100 | #99 | Exceptional 2.1% |
| Immigrants | Northern Africa | 99.0 /100 | #100 | Exceptional 2.1% |
| Immigrants | Western Europe | 98.9 /100 | #101 | Exceptional 2.1% |
| Argentineans | 98.9 /100 | #102 | Exceptional 2.1% |
| Lebanese | 98.9 /100 | #103 | Exceptional 2.1% |
| Alsatians | 98.9 /100 | #104 | Exceptional 2.1% |
| Palestinians | 98.6 /100 | #105 | Exceptional 2.2% |
| Immigrants | Southern Europe | 98.6 /100 | #106 | Exceptional 2.2% |
| Slovenes | 98.5 /100 | #107 | Exceptional 2.2% |
| Immigrants | Netherlands | 98.5 /100 | #108 | Exceptional 2.2% |
| Barbadians | 98.4 /100 | #109 | Exceptional 2.2% |
| Italians | 98.3 /100 | #110 | Exceptional 2.2% |
| Immigrants | Canada | 98.3 /100 | #111 | Exceptional 2.2% |
| Immigrants | Trinidad and Tobago | 98.2 /100 | #112 | Exceptional 2.2% |