Bahamian vs Palestinian Single Father Households
COMPARE
Bahamian
Palestinian
Single Father Households
Single Father Households Comparison
Bahamians
Palestinians
2.5%
SINGLE FATHER HOUSEHOLDS
2.4/ 100
METRIC RATING
248th/ 347
METRIC RANK
2.2%
SINGLE FATHER HOUSEHOLDS
98.6/ 100
METRIC RATING
105th/ 347
METRIC RANK
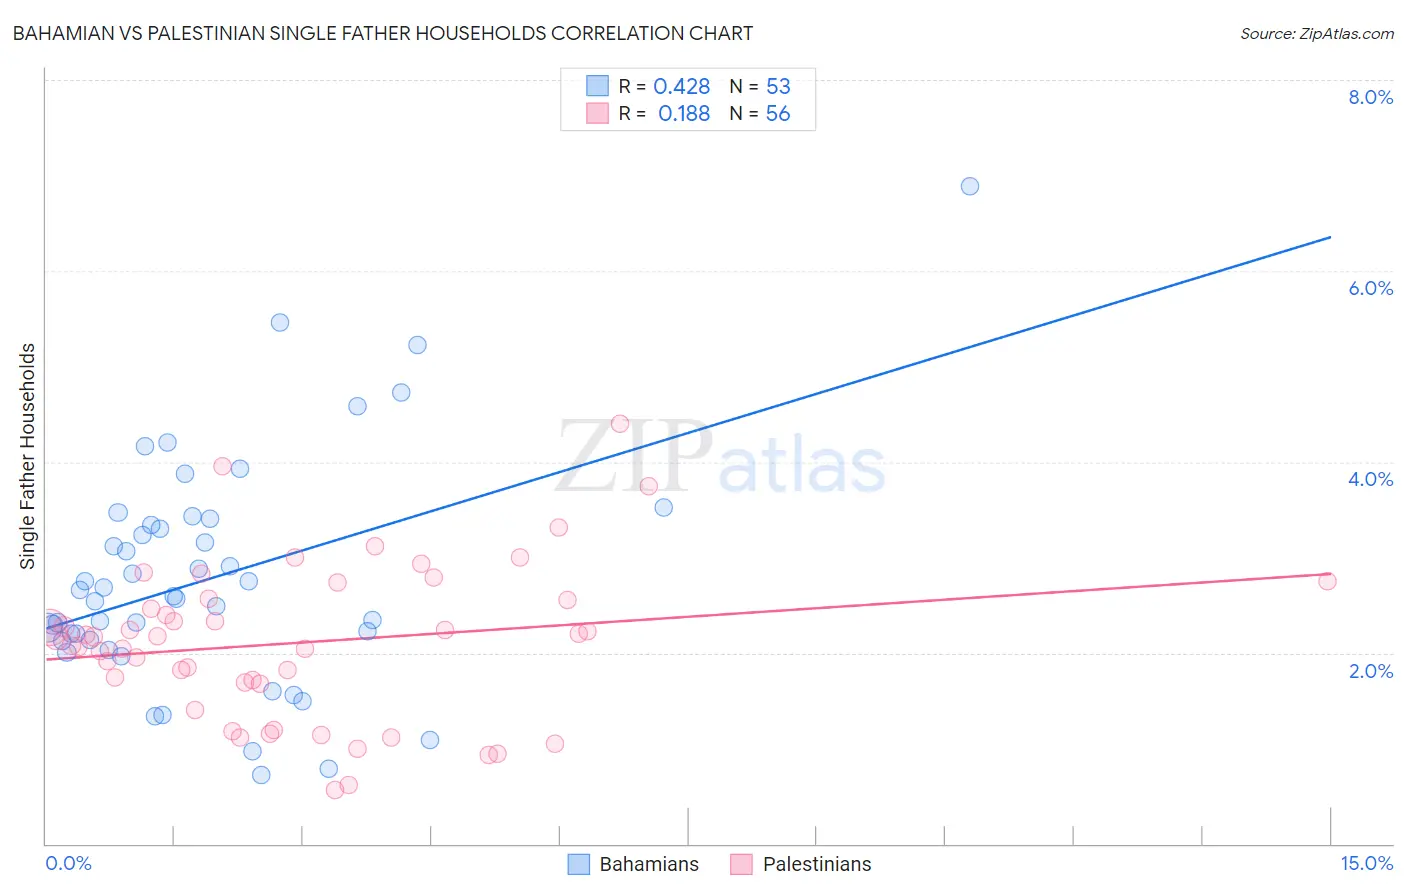
Bahamian vs Palestinian Single Father Households Correlation Chart
The statistical analysis conducted on geographies consisting of 112,214,100 people shows a moderate positive correlation between the proportion of Bahamians and percentage of single father households in the United States with a correlation coefficient (R) of 0.428 and weighted average of 2.5%. Similarly, the statistical analysis conducted on geographies consisting of 215,869,880 people shows a poor positive correlation between the proportion of Palestinians and percentage of single father households in the United States with a correlation coefficient (R) of 0.188 and weighted average of 2.2%, a difference of 15.9%.
Single Father Households Correlation Summary
| Measurement | Bahamian | Palestinian |
| Minimum | 0.72% | 0.57% |
| Maximum | 6.9% | 4.4% |
| Range | 6.2% | 3.8% |
| Mean | 2.8% | 2.1% |
| Median | 2.6% | 2.2% |
| Interquartile 25% (IQ1) | 2.1% | 1.7% |
| Interquartile 75% (IQ3) | 3.4% | 2.6% |
| Interquartile Range (IQR) | 1.2% | 0.88% |
| Standard Deviation (Sample) | 1.2% | 0.81% |
| Standard Deviation (Population) | 1.2% | 0.80% |
Similar Demographics by Single Father Households
Demographics Similar to Bahamians by Single Father Households
In terms of single father households, the demographic groups most similar to Bahamians are Delaware (2.5%, a difference of 0.040%), Native Hawaiian (2.5%, a difference of 0.060%), Basque (2.5%, a difference of 0.080%), Immigrants from Cameroon (2.5%, a difference of 0.090%), and Somali (2.5%, a difference of 0.25%).
| Demographics | Rating | Rank | Single Father Households |
| Portuguese | 4.1 /100 | #241 | Tragic 2.5% |
| Osage | 4.1 /100 | #242 | Tragic 2.5% |
| Spaniards | 3.1 /100 | #243 | Tragic 2.5% |
| Immigrants | Middle Africa | 2.8 /100 | #244 | Tragic 2.5% |
| Basques | 2.5 /100 | #245 | Tragic 2.5% |
| Native Hawaiians | 2.5 /100 | #246 | Tragic 2.5% |
| Delaware | 2.5 /100 | #247 | Tragic 2.5% |
| Bahamians | 2.4 /100 | #248 | Tragic 2.5% |
| Immigrants | Cameroon | 2.3 /100 | #249 | Tragic 2.5% |
| Somalis | 2.1 /100 | #250 | Tragic 2.5% |
| Liberians | 2.0 /100 | #251 | Tragic 2.5% |
| Immigrants | Eritrea | 2.0 /100 | #252 | Tragic 2.5% |
| Immigrants | Somalia | 1.9 /100 | #253 | Tragic 2.5% |
| Immigrants | Thailand | 1.8 /100 | #254 | Tragic 2.5% |
| Tongans | 1.5 /100 | #255 | Tragic 2.5% |
Demographics Similar to Palestinians by Single Father Households
In terms of single father households, the demographic groups most similar to Palestinians are Immigrants from Southern Europe (2.2%, a difference of 0.11%), Slovene (2.2%, a difference of 0.23%), Immigrants from Netherlands (2.2%, a difference of 0.25%), Barbadian (2.2%, a difference of 0.29%), and Alsatian (2.1%, a difference of 0.37%).
| Demographics | Rating | Rank | Single Father Households |
| Guyanese | 99.1 /100 | #98 | Exceptional 2.1% |
| South Africans | 99.1 /100 | #99 | Exceptional 2.1% |
| Immigrants | Northern Africa | 99.0 /100 | #100 | Exceptional 2.1% |
| Immigrants | Western Europe | 98.9 /100 | #101 | Exceptional 2.1% |
| Argentineans | 98.9 /100 | #102 | Exceptional 2.1% |
| Lebanese | 98.9 /100 | #103 | Exceptional 2.1% |
| Alsatians | 98.9 /100 | #104 | Exceptional 2.1% |
| Palestinians | 98.6 /100 | #105 | Exceptional 2.2% |
| Immigrants | Southern Europe | 98.6 /100 | #106 | Exceptional 2.2% |
| Slovenes | 98.5 /100 | #107 | Exceptional 2.2% |
| Immigrants | Netherlands | 98.5 /100 | #108 | Exceptional 2.2% |
| Barbadians | 98.4 /100 | #109 | Exceptional 2.2% |
| Italians | 98.3 /100 | #110 | Exceptional 2.2% |
| Immigrants | Canada | 98.3 /100 | #111 | Exceptional 2.2% |
| Immigrants | Trinidad and Tobago | 98.2 /100 | #112 | Exceptional 2.2% |