Lumbee vs Alaska Native Single Father Households
COMPARE
Lumbee
Alaska Native
Single Father Households
Single Father Households Comparison
Lumbee
Alaska Natives
2.8%
SINGLE FATHER HOUSEHOLDS
0.0/ 100
METRIC RATING
299th/ 347
METRIC RANK
3.5%
SINGLE FATHER HOUSEHOLDS
0.0/ 100
METRIC RATING
340th/ 347
METRIC RANK
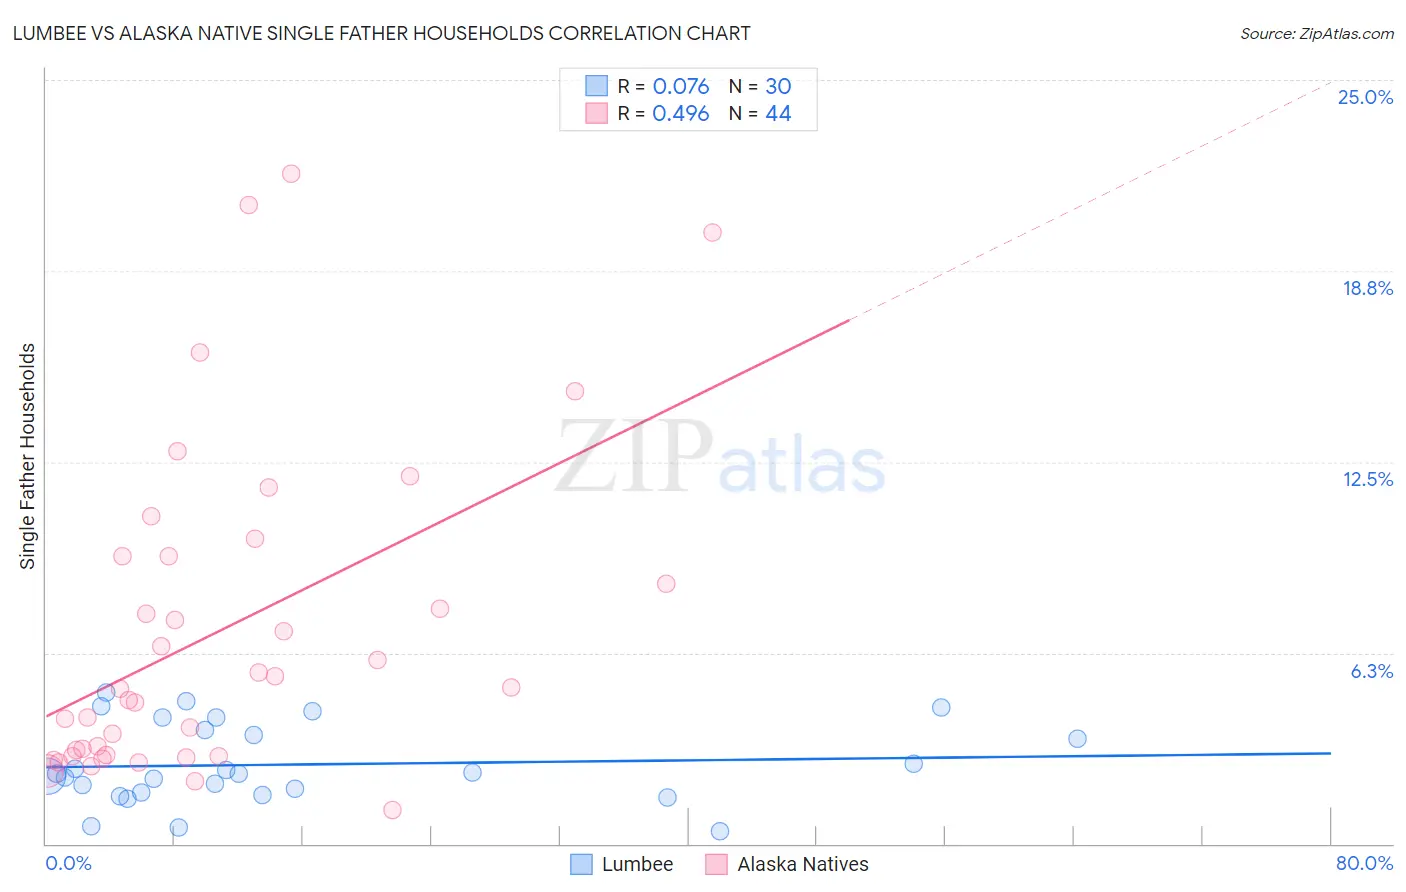
Lumbee vs Alaska Native Single Father Households Correlation Chart
The statistical analysis conducted on geographies consisting of 91,890,411 people shows a slight positive correlation between the proportion of Lumbee and percentage of single father households in the United States with a correlation coefficient (R) of 0.076 and weighted average of 2.8%. Similarly, the statistical analysis conducted on geographies consisting of 76,608,440 people shows a moderate positive correlation between the proportion of Alaska Natives and percentage of single father households in the United States with a correlation coefficient (R) of 0.496 and weighted average of 3.5%, a difference of 26.1%.
Single Father Households Correlation Summary
| Measurement | Lumbee | Alaska Native |
| Minimum | 0.41% | 1.1% |
| Maximum | 5.0% | 21.9% |
| Range | 4.5% | 20.8% |
| Mean | 2.6% | 7.0% |
| Median | 2.3% | 5.1% |
| Interquartile 25% (IQ1) | 1.7% | 2.9% |
| Interquartile 75% (IQ3) | 3.7% | 9.4% |
| Interquartile Range (IQR) | 2.0% | 6.5% |
| Standard Deviation (Sample) | 1.3% | 5.3% |
| Standard Deviation (Population) | 1.3% | 5.2% |
Similar Demographics by Single Father Households
Demographics Similar to Lumbee by Single Father Households
In terms of single father households, the demographic groups most similar to Lumbee are Cree (2.8%, a difference of 0.38%), Kiowa (2.8%, a difference of 0.40%), Immigrants from Latin America (2.8%, a difference of 0.45%), Honduran (2.8%, a difference of 0.87%), and Japanese (2.8%, a difference of 0.95%).
| Demographics | Rating | Rank | Single Father Households |
| Choctaw | 0.0 /100 | #292 | Tragic 2.7% |
| Immigrants | Fiji | 0.0 /100 | #293 | Tragic 2.7% |
| Malaysians | 0.0 /100 | #294 | Tragic 2.7% |
| Chickasaw | 0.0 /100 | #295 | Tragic 2.8% |
| Japanese | 0.0 /100 | #296 | Tragic 2.8% |
| Hondurans | 0.0 /100 | #297 | Tragic 2.8% |
| Cree | 0.0 /100 | #298 | Tragic 2.8% |
| Lumbee | 0.0 /100 | #299 | Tragic 2.8% |
| Kiowa | 0.0 /100 | #300 | Tragic 2.8% |
| Immigrants | Latin America | 0.0 /100 | #301 | Tragic 2.8% |
| Spanish Americans | 0.0 /100 | #302 | Tragic 2.8% |
| Immigrants | Honduras | 0.0 /100 | #303 | Tragic 2.8% |
| Mexican American Indians | 0.0 /100 | #304 | Tragic 2.8% |
| Hispanics or Latinos | 0.0 /100 | #305 | Tragic 2.8% |
| Immigrants | Azores | 0.0 /100 | #306 | Tragic 2.8% |
Demographics Similar to Alaska Natives by Single Father Households
In terms of single father households, the demographic groups most similar to Alaska Natives are Crow (3.5%, a difference of 0.35%), Alaskan Athabascan (3.4%, a difference of 3.8%), Sioux (3.3%, a difference of 5.3%), Pueblo (3.3%, a difference of 6.0%), and Paiute (3.3%, a difference of 6.2%).
| Demographics | Rating | Rank | Single Father Households |
| Natives/Alaskans | 0.0 /100 | #333 | Tragic 3.2% |
| Yuman | 0.0 /100 | #334 | Tragic 3.3% |
| Colville | 0.0 /100 | #335 | Tragic 3.3% |
| Paiute | 0.0 /100 | #336 | Tragic 3.3% |
| Pueblo | 0.0 /100 | #337 | Tragic 3.3% |
| Sioux | 0.0 /100 | #338 | Tragic 3.3% |
| Alaskan Athabascans | 0.0 /100 | #339 | Tragic 3.4% |
| Alaska Natives | 0.0 /100 | #340 | Tragic 3.5% |
| Crow | 0.0 /100 | #341 | Tragic 3.5% |
| Tohono O'odham | 0.0 /100 | #342 | Tragic 3.8% |
| Pima | 0.0 /100 | #343 | Tragic 4.2% |
| Yakama | 0.0 /100 | #344 | Tragic 4.2% |
| Menominee | 0.0 /100 | #345 | Tragic 4.2% |
| Inupiat | 0.0 /100 | #346 | Tragic 4.9% |
| Yup'ik | 0.0 /100 | #347 | Tragic 5.4% |