Lumbee vs Marshallese Single Father Households
COMPARE
Lumbee
Marshallese
Single Father Households
Single Father Households Comparison
Lumbee
Marshallese
2.8%
SINGLE FATHER HOUSEHOLDS
0.0/ 100
METRIC RATING
299th/ 347
METRIC RANK
2.4%
SINGLE FATHER HOUSEHOLDS
9.7/ 100
METRIC RATING
225th/ 347
METRIC RANK
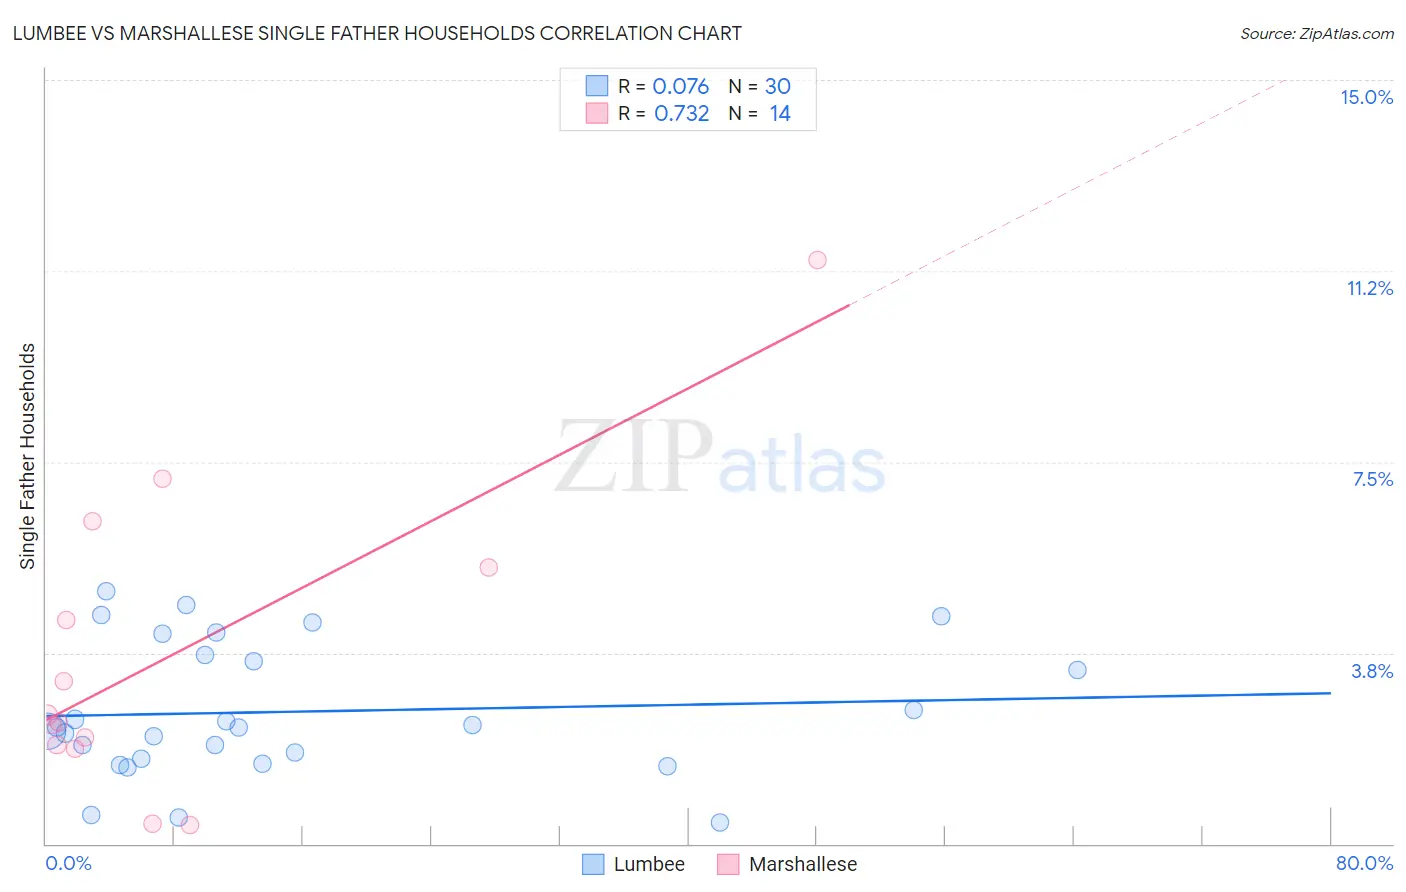
Lumbee vs Marshallese Single Father Households Correlation Chart
The statistical analysis conducted on geographies consisting of 91,890,411 people shows a slight positive correlation between the proportion of Lumbee and percentage of single father households in the United States with a correlation coefficient (R) of 0.076 and weighted average of 2.8%. Similarly, the statistical analysis conducted on geographies consisting of 14,759,622 people shows a strong positive correlation between the proportion of Marshallese and percentage of single father households in the United States with a correlation coefficient (R) of 0.732 and weighted average of 2.4%, a difference of 14.2%.
Single Father Households Correlation Summary
| Measurement | Lumbee | Marshallese |
| Minimum | 0.41% | 0.37% |
| Maximum | 5.0% | 11.5% |
| Range | 4.5% | 11.1% |
| Mean | 2.6% | 3.7% |
| Median | 2.3% | 2.5% |
| Interquartile 25% (IQ1) | 1.7% | 1.9% |
| Interquartile 75% (IQ3) | 3.7% | 5.4% |
| Interquartile Range (IQR) | 2.0% | 3.5% |
| Standard Deviation (Sample) | 1.3% | 3.0% |
| Standard Deviation (Population) | 1.3% | 2.9% |
Similar Demographics by Single Father Households
Demographics Similar to Lumbee by Single Father Households
In terms of single father households, the demographic groups most similar to Lumbee are Cree (2.8%, a difference of 0.38%), Kiowa (2.8%, a difference of 0.40%), Immigrants from Latin America (2.8%, a difference of 0.45%), Honduran (2.8%, a difference of 0.87%), and Japanese (2.8%, a difference of 0.95%).
| Demographics | Rating | Rank | Single Father Households |
| Choctaw | 0.0 /100 | #292 | Tragic 2.7% |
| Immigrants | Fiji | 0.0 /100 | #293 | Tragic 2.7% |
| Malaysians | 0.0 /100 | #294 | Tragic 2.7% |
| Chickasaw | 0.0 /100 | #295 | Tragic 2.8% |
| Japanese | 0.0 /100 | #296 | Tragic 2.8% |
| Hondurans | 0.0 /100 | #297 | Tragic 2.8% |
| Cree | 0.0 /100 | #298 | Tragic 2.8% |
| Lumbee | 0.0 /100 | #299 | Tragic 2.8% |
| Kiowa | 0.0 /100 | #300 | Tragic 2.8% |
| Immigrants | Latin America | 0.0 /100 | #301 | Tragic 2.8% |
| Spanish Americans | 0.0 /100 | #302 | Tragic 2.8% |
| Immigrants | Honduras | 0.0 /100 | #303 | Tragic 2.8% |
| Mexican American Indians | 0.0 /100 | #304 | Tragic 2.8% |
| Hispanics or Latinos | 0.0 /100 | #305 | Tragic 2.8% |
| Immigrants | Azores | 0.0 /100 | #306 | Tragic 2.8% |
Demographics Similar to Marshallese by Single Father Households
In terms of single father households, the demographic groups most similar to Marshallese are Black/African American (2.4%, a difference of 0.010%), American (2.4%, a difference of 0.080%), Immigrants from Ghana (2.4%, a difference of 0.12%), Immigrants from Bahamas (2.4%, a difference of 0.17%), and Immigrants from Zaire (2.4%, a difference of 0.23%).
| Demographics | Rating | Rank | Single Father Households |
| Immigrants | Ethiopia | 13.4 /100 | #218 | Poor 2.4% |
| Sudanese | 13.0 /100 | #219 | Poor 2.4% |
| Ghanaians | 12.9 /100 | #220 | Poor 2.4% |
| Immigrants | Burma/Myanmar | 12.1 /100 | #221 | Poor 2.4% |
| Immigrants | Eastern Africa | 11.9 /100 | #222 | Poor 2.4% |
| Immigrants | Uruguay | 11.0 /100 | #223 | Poor 2.4% |
| Immigrants | Bahamas | 10.6 /100 | #224 | Poor 2.4% |
| Marshallese | 9.7 /100 | #225 | Tragic 2.4% |
| Blacks/African Americans | 9.7 /100 | #226 | Tragic 2.4% |
| Americans | 9.3 /100 | #227 | Tragic 2.4% |
| Immigrants | Ghana | 9.1 /100 | #228 | Tragic 2.4% |
| Immigrants | Zaire | 8.6 /100 | #229 | Tragic 2.4% |
| Sub-Saharan Africans | 8.3 /100 | #230 | Tragic 2.4% |
| Immigrants | Nonimmigrants | 7.6 /100 | #231 | Tragic 2.4% |
| Pennsylvania Germans | 7.3 /100 | #232 | Tragic 2.4% |