Nigerian vs Norwegian Births to Unmarried Women
COMPARE
Nigerian
Norwegian
Births to Unmarried Women
Births to Unmarried Women Comparison
Nigerians
Norwegians
35.3%
BIRTHS TO UNMARRIED WOMEN
0.7/ 100
METRIC RATING
246th/ 347
METRIC RANK
29.3%
BIRTHS TO UNMARRIED WOMEN
95.8/ 100
METRIC RATING
96th/ 347
METRIC RANK
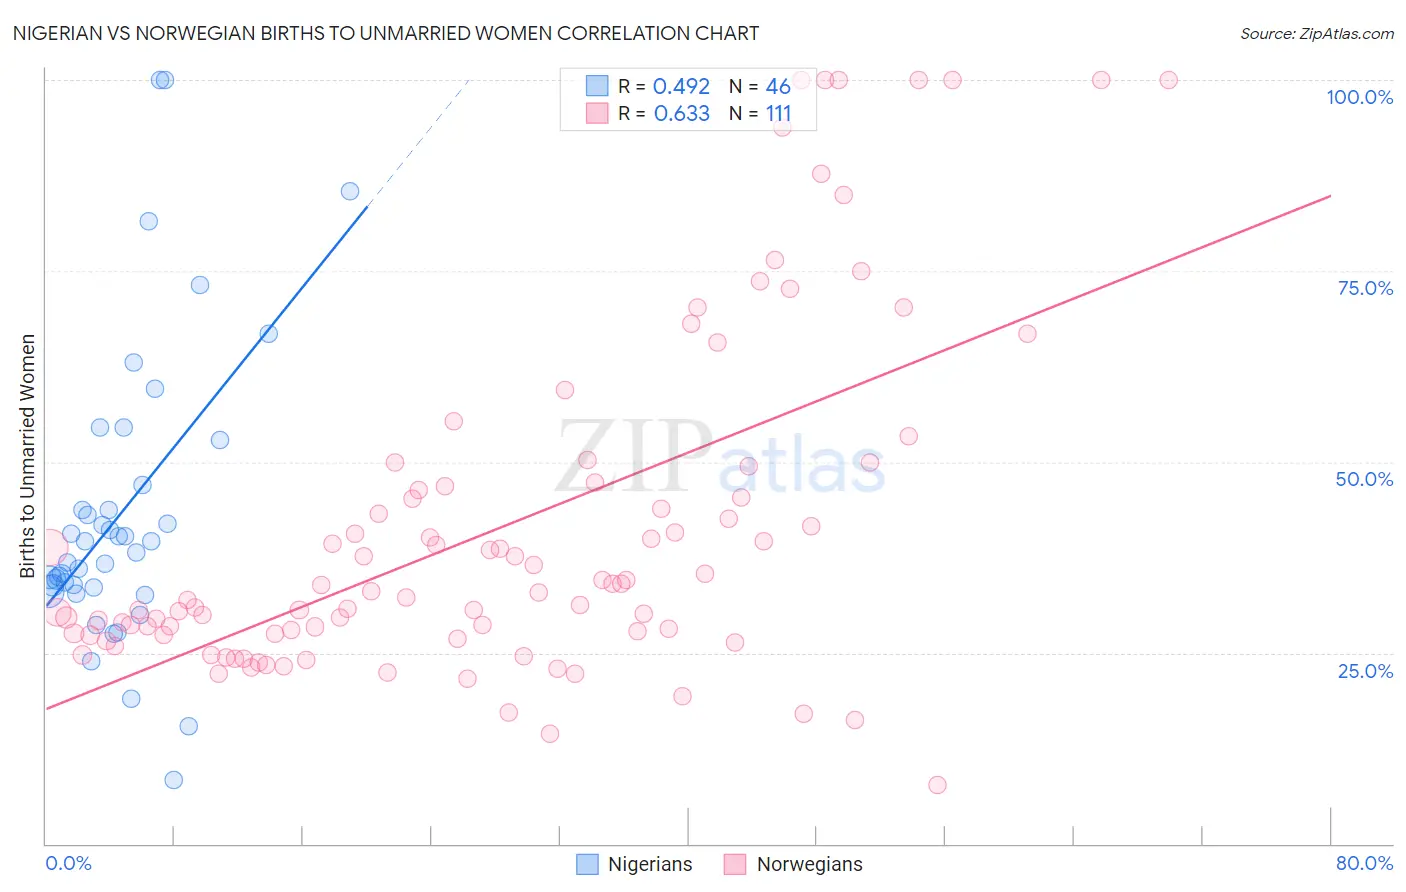
Nigerian vs Norwegian Births to Unmarried Women Correlation Chart
The statistical analysis conducted on geographies consisting of 318,352,588 people shows a moderate positive correlation between the proportion of Nigerians and percentage of births to unmarried women in the United States with a correlation coefficient (R) of 0.492 and weighted average of 35.3%. Similarly, the statistical analysis conducted on geographies consisting of 477,355,885 people shows a significant positive correlation between the proportion of Norwegians and percentage of births to unmarried women in the United States with a correlation coefficient (R) of 0.633 and weighted average of 29.3%, a difference of 20.4%.
Births to Unmarried Women Correlation Summary
| Measurement | Nigerian | Norwegian |
| Minimum | 8.3% | 7.7% |
| Maximum | 100.0% | 100.0% |
| Range | 91.7% | 92.3% |
| Mean | 43.4% | 41.3% |
| Median | 38.8% | 32.9% |
| Interquartile 25% (IQ1) | 33.6% | 27.3% |
| Interquartile 75% (IQ3) | 46.9% | 46.7% |
| Interquartile Range (IQR) | 13.3% | 19.4% |
| Standard Deviation (Sample) | 19.5% | 22.3% |
| Standard Deviation (Population) | 19.3% | 22.2% |
Similar Demographics by Births to Unmarried Women
Demographics Similar to Nigerians by Births to Unmarried Women
In terms of births to unmarried women, the demographic groups most similar to Nigerians are Shoshone (35.3%, a difference of 0.11%), Immigrants from Nigeria (35.4%, a difference of 0.21%), Guyanese (35.2%, a difference of 0.45%), Japanese (35.2%, a difference of 0.51%), and Nonimmigrants (35.5%, a difference of 0.54%).
| Demographics | Rating | Rank | Births to Unmarried Women |
| Sierra Leoneans | 1.4 /100 | #239 | Tragic 34.9% |
| Immigrants | Middle Africa | 1.2 /100 | #240 | Tragic 34.9% |
| Immigrants | Guyana | 1.2 /100 | #241 | Tragic 35.0% |
| Indonesians | 1.2 /100 | #242 | Tragic 35.0% |
| Japanese | 0.9 /100 | #243 | Tragic 35.2% |
| Guyanese | 0.9 /100 | #244 | Tragic 35.2% |
| Shoshone | 0.8 /100 | #245 | Tragic 35.3% |
| Nigerians | 0.7 /100 | #246 | Tragic 35.3% |
| Immigrants | Nigeria | 0.7 /100 | #247 | Tragic 35.4% |
| Immigrants | Nonimmigrants | 0.6 /100 | #248 | Tragic 35.5% |
| Bermudans | 0.6 /100 | #249 | Tragic 35.5% |
| Mexican American Indians | 0.4 /100 | #250 | Tragic 35.7% |
| Immigrants | Western Africa | 0.3 /100 | #251 | Tragic 36.0% |
| Salvadorans | 0.3 /100 | #252 | Tragic 36.0% |
| Immigrants | Portugal | 0.2 /100 | #253 | Tragic 36.2% |
Demographics Similar to Norwegians by Births to Unmarried Women
In terms of births to unmarried women, the demographic groups most similar to Norwegians are Immigrants from South Africa (29.3%, a difference of 0.040%), Immigrants from Syria (29.4%, a difference of 0.070%), Immigrants from Vietnam (29.3%, a difference of 0.23%), Immigrants from Denmark (29.4%, a difference of 0.30%), and Luxembourger (29.4%, a difference of 0.30%).
| Demographics | Rating | Rank | Births to Unmarried Women |
| Immigrants | Saudi Arabia | 97.0 /100 | #89 | Exceptional 29.1% |
| Immigrants | Latvia | 96.8 /100 | #90 | Exceptional 29.1% |
| Immigrants | Fiji | 96.6 /100 | #91 | Exceptional 29.2% |
| Arabs | 96.5 /100 | #92 | Exceptional 29.2% |
| Estonians | 96.5 /100 | #93 | Exceptional 29.2% |
| Ukrainians | 96.3 /100 | #94 | Exceptional 29.2% |
| Immigrants | Vietnam | 96.1 /100 | #95 | Exceptional 29.3% |
| Norwegians | 95.8 /100 | #96 | Exceptional 29.3% |
| Immigrants | South Africa | 95.7 /100 | #97 | Exceptional 29.3% |
| Immigrants | Syria | 95.7 /100 | #98 | Exceptional 29.4% |
| Immigrants | Denmark | 95.3 /100 | #99 | Exceptional 29.4% |
| Luxembourgers | 95.2 /100 | #100 | Exceptional 29.4% |
| Immigrants | Northern Africa | 94.7 /100 | #101 | Exceptional 29.5% |
| Australians | 94.6 /100 | #102 | Exceptional 29.5% |
| Lebanese | 94.4 /100 | #103 | Exceptional 29.5% |