Lithuanian vs Norwegian In Labor Force | Age > 16
COMPARE
Lithuanian
Norwegian
In Labor Force | Age > 16
In Labor Force | Age > 16 Comparison
Lithuanians
Norwegians
64.8%
IN LABOR FORCE | AGE > 16
17.4/ 100
METRIC RATING
206th/ 347
METRIC RANK
65.7%
IN LABOR FORCE | AGE > 16
95.3/ 100
METRIC RATING
125th/ 347
METRIC RANK
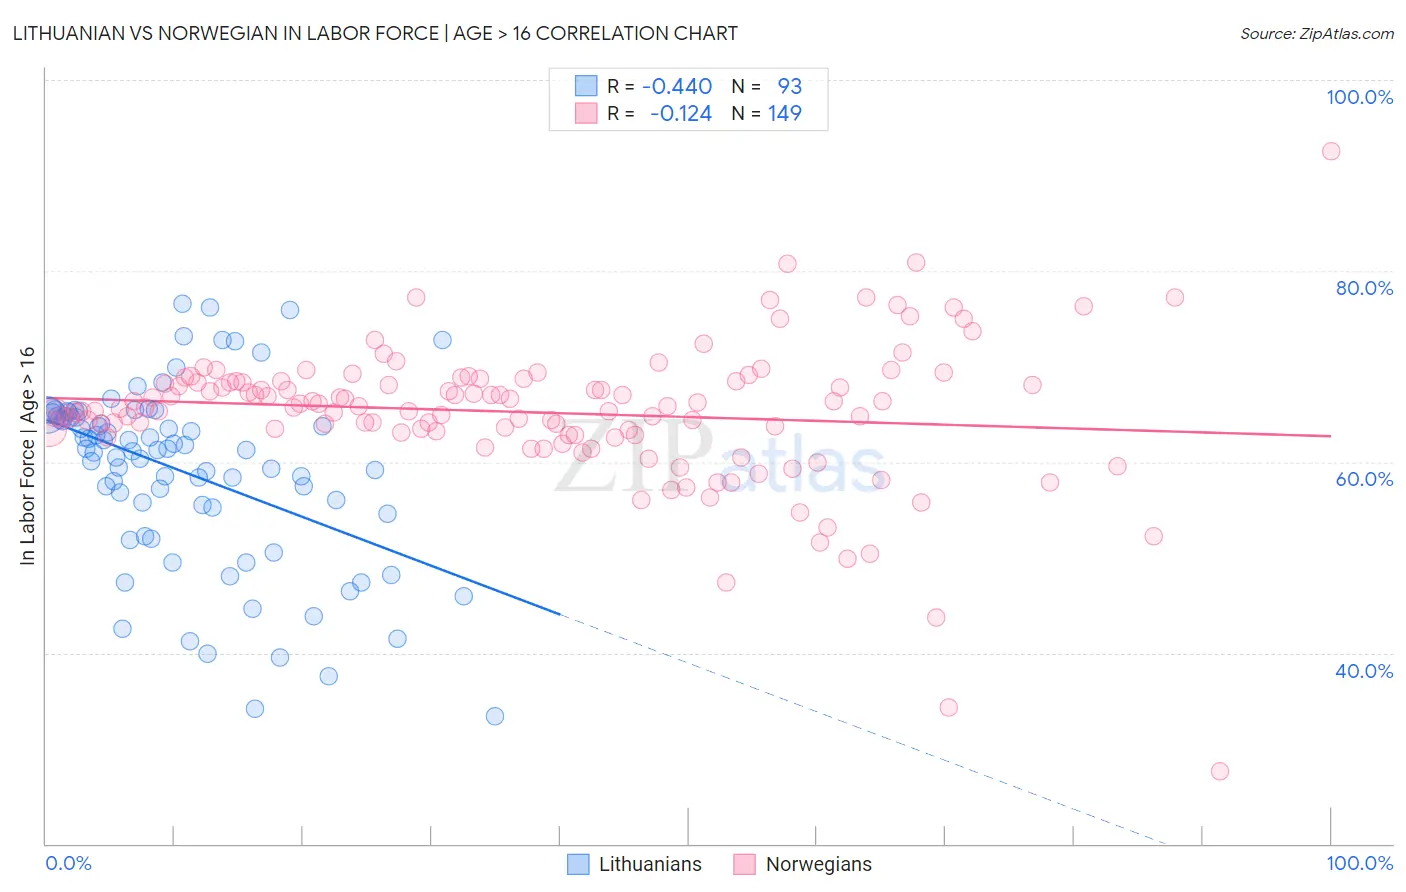
Lithuanian vs Norwegian In Labor Force | Age > 16 Correlation Chart
The statistical analysis conducted on geographies consisting of 421,961,459 people shows a moderate negative correlation between the proportion of Lithuanians and labor force participation rate among population ages 16 and over in the United States with a correlation coefficient (R) of -0.440 and weighted average of 64.8%. Similarly, the statistical analysis conducted on geographies consisting of 533,394,126 people shows a poor negative correlation between the proportion of Norwegians and labor force participation rate among population ages 16 and over in the United States with a correlation coefficient (R) of -0.124 and weighted average of 65.7%, a difference of 1.3%.
In Labor Force | Age > 16 Correlation Summary
| Measurement | Lithuanian | Norwegian |
| Minimum | 33.3% | 27.6% |
| Maximum | 76.6% | 92.5% |
| Range | 43.3% | 64.9% |
| Mean | 59.0% | 65.2% |
| Median | 61.2% | 65.8% |
| Interquartile 25% (IQ1) | 54.9% | 62.9% |
| Interquartile 75% (IQ3) | 64.8% | 68.5% |
| Interquartile Range (IQR) | 9.9% | 5.5% |
| Standard Deviation (Sample) | 9.4% | 7.5% |
| Standard Deviation (Population) | 9.4% | 7.5% |
Similar Demographics by In Labor Force | Age > 16
Demographics Similar to Lithuanians by In Labor Force | Age > 16
In terms of in labor force | age > 16, the demographic groups most similar to Lithuanians are Immigrants from Latin America (64.8%, a difference of 0.020%), Belizean (64.8%, a difference of 0.020%), Russian (64.9%, a difference of 0.030%), Slovene (64.9%, a difference of 0.030%), and Jamaican (64.9%, a difference of 0.030%).
| Demographics | Rating | Rank | In Labor Force | Age > 16 |
| Mexican American Indians | 23.1 /100 | #199 | Fair 64.9% |
| Armenians | 20.2 /100 | #200 | Fair 64.9% |
| Ukrainians | 19.6 /100 | #201 | Poor 64.9% |
| Immigrants | Belgium | 19.4 /100 | #202 | Poor 64.9% |
| Russians | 18.8 /100 | #203 | Poor 64.9% |
| Slovenes | 18.7 /100 | #204 | Poor 64.9% |
| Jamaicans | 18.7 /100 | #205 | Poor 64.9% |
| Lithuanians | 17.4 /100 | #206 | Poor 64.8% |
| Immigrants | Latin America | 16.4 /100 | #207 | Poor 64.8% |
| Belizeans | 16.2 /100 | #208 | Poor 64.8% |
| Immigrants | Trinidad and Tobago | 15.6 /100 | #209 | Poor 64.8% |
| Immigrants | Denmark | 14.7 /100 | #210 | Poor 64.8% |
| Fijians | 14.1 /100 | #211 | Poor 64.8% |
| Alaskan Athabascans | 13.9 /100 | #212 | Poor 64.8% |
| Maltese | 13.8 /100 | #213 | Poor 64.8% |
Demographics Similar to Norwegians by In Labor Force | Age > 16
In terms of in labor force | age > 16, the demographic groups most similar to Norwegians are Korean (65.7%, a difference of 0.0%), Immigrants from Iraq (65.7%, a difference of 0.010%), Iraqi (65.7%, a difference of 0.010%), Immigrants from Eastern Asia (65.7%, a difference of 0.030%), and Ecuadorian (65.6%, a difference of 0.030%).
| Demographics | Rating | Rank | In Labor Force | Age > 16 |
| Immigrants | Thailand | 96.6 /100 | #118 | Exceptional 65.7% |
| Immigrants | France | 96.4 /100 | #119 | Exceptional 65.7% |
| Immigrants | Hong Kong | 96.2 /100 | #120 | Exceptional 65.7% |
| New Zealanders | 96.0 /100 | #121 | Exceptional 65.7% |
| Immigrants | Ecuador | 95.9 /100 | #122 | Exceptional 65.7% |
| Immigrants | Iraq | 95.5 /100 | #123 | Exceptional 65.7% |
| Iraqis | 95.4 /100 | #124 | Exceptional 65.7% |
| Norwegians | 95.3 /100 | #125 | Exceptional 65.7% |
| Koreans | 95.3 /100 | #126 | Exceptional 65.7% |
| Immigrants | Eastern Asia | 94.9 /100 | #127 | Exceptional 65.7% |
| Ecuadorians | 94.7 /100 | #128 | Exceptional 65.6% |
| Immigrants | Philippines | 94.5 /100 | #129 | Exceptional 65.6% |
| Immigrants | Guatemala | 94.4 /100 | #130 | Exceptional 65.6% |
| Icelanders | 94.3 /100 | #131 | Exceptional 65.6% |
| Immigrants | North Macedonia | 94.1 /100 | #132 | Exceptional 65.6% |