Immigrants from Italy vs Norwegian Births to Unmarried Women
COMPARE
Immigrants from Italy
Norwegian
Births to Unmarried Women
Births to Unmarried Women Comparison
Immigrants from Italy
Norwegians
29.9%
BIRTHS TO UNMARRIED WOMEN
91.7/ 100
METRIC RATING
116th/ 347
METRIC RANK
29.3%
BIRTHS TO UNMARRIED WOMEN
95.8/ 100
METRIC RATING
96th/ 347
METRIC RANK
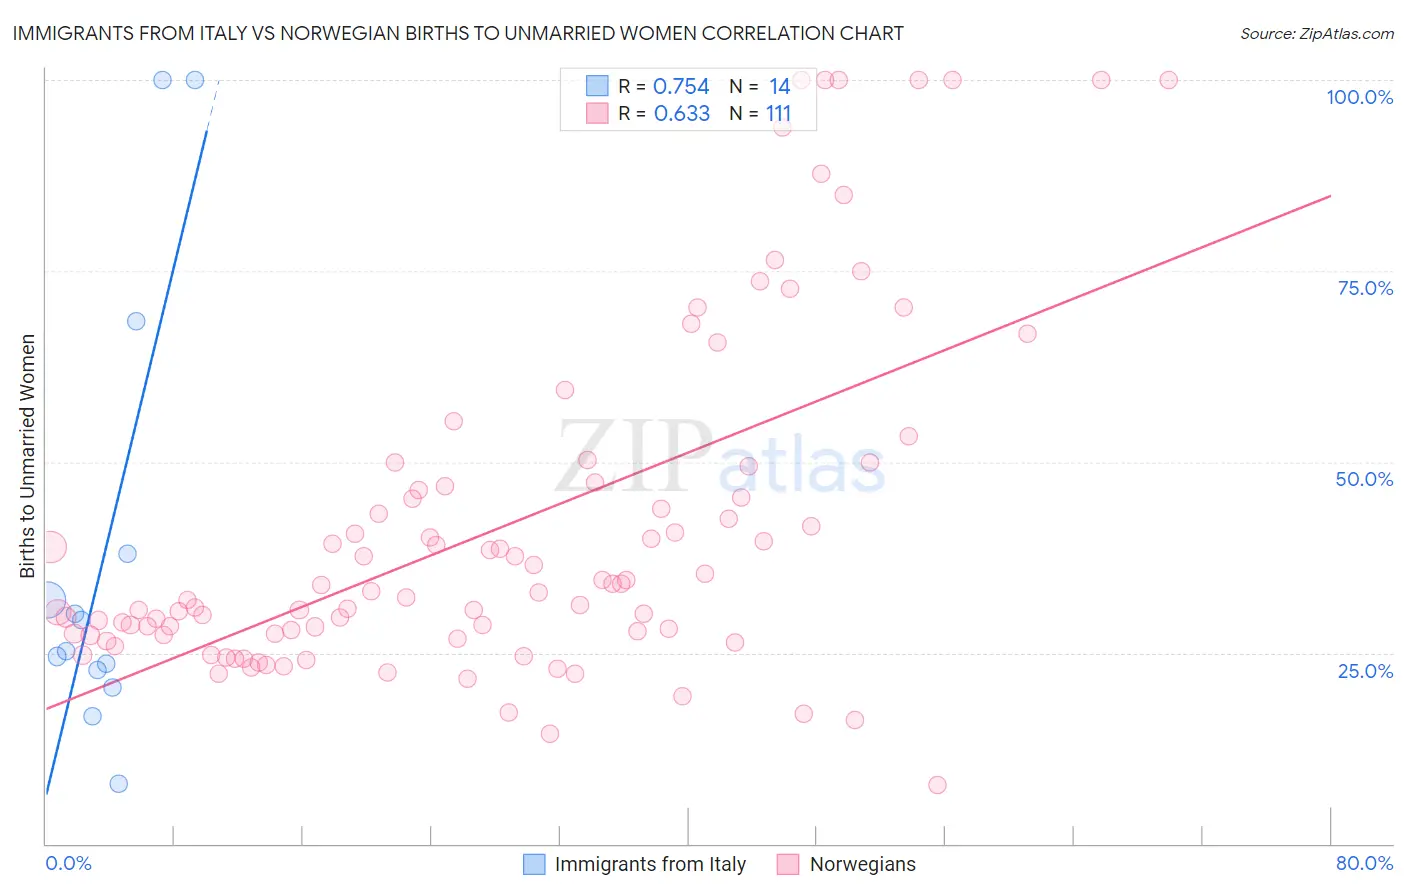
Immigrants from Italy vs Norwegian Births to Unmarried Women Correlation Chart
The statistical analysis conducted on geographies consisting of 300,581,400 people shows a strong positive correlation between the proportion of Immigrants from Italy and percentage of births to unmarried women in the United States with a correlation coefficient (R) of 0.754 and weighted average of 29.9%. Similarly, the statistical analysis conducted on geographies consisting of 477,355,885 people shows a significant positive correlation between the proportion of Norwegians and percentage of births to unmarried women in the United States with a correlation coefficient (R) of 0.633 and weighted average of 29.3%, a difference of 1.8%.
Births to Unmarried Women Correlation Summary
| Measurement | Immigrants from Italy | Norwegian |
| Minimum | 7.9% | 7.7% |
| Maximum | 100.0% | 100.0% |
| Range | 92.1% | 92.3% |
| Mean | 38.5% | 41.3% |
| Median | 27.2% | 32.9% |
| Interquartile 25% (IQ1) | 22.8% | 27.3% |
| Interquartile 75% (IQ3) | 38.0% | 46.7% |
| Interquartile Range (IQR) | 15.2% | 19.4% |
| Standard Deviation (Sample) | 29.4% | 22.3% |
| Standard Deviation (Population) | 28.3% | 22.2% |
Demographics Similar to Immigrants from Italy and Norwegians by Births to Unmarried Women
In terms of births to unmarried women, the demographic groups most similar to Immigrants from Italy are Ethiopian (29.8%, a difference of 0.080%), Immigrants from Croatia (29.8%, a difference of 0.30%), Scandinavian (29.8%, a difference of 0.36%), Basque (29.7%, a difference of 0.46%), and Immigrants from Hungary (29.7%, a difference of 0.47%). Similarly, the demographic groups most similar to Norwegians are Immigrants from South Africa (29.3%, a difference of 0.040%), Immigrants from Syria (29.4%, a difference of 0.070%), Immigrants from Denmark (29.4%, a difference of 0.30%), Luxembourger (29.4%, a difference of 0.30%), and Immigrants from Northern Africa (29.5%, a difference of 0.60%).
| Demographics | Rating | Rank | Births to Unmarried Women |
| Norwegians | 95.8 /100 | #96 | Exceptional 29.3% |
| Immigrants | South Africa | 95.7 /100 | #97 | Exceptional 29.3% |
| Immigrants | Syria | 95.7 /100 | #98 | Exceptional 29.4% |
| Immigrants | Denmark | 95.3 /100 | #99 | Exceptional 29.4% |
| Luxembourgers | 95.2 /100 | #100 | Exceptional 29.4% |
| Immigrants | Northern Africa | 94.7 /100 | #101 | Exceptional 29.5% |
| Australians | 94.6 /100 | #102 | Exceptional 29.5% |
| Lebanese | 94.4 /100 | #103 | Exceptional 29.5% |
| Lithuanians | 94.4 /100 | #104 | Exceptional 29.6% |
| Immigrants | Nepal | 94.3 /100 | #105 | Exceptional 29.6% |
| Swedes | 93.8 /100 | #106 | Exceptional 29.6% |
| Immigrants | Brazil | 93.7 /100 | #107 | Exceptional 29.6% |
| Paraguayans | 93.5 /100 | #108 | Exceptional 29.7% |
| Greeks | 93.4 /100 | #109 | Exceptional 29.7% |
| Immigrants | Ethiopia | 93.4 /100 | #110 | Exceptional 29.7% |
| Immigrants | Hungary | 93.0 /100 | #111 | Exceptional 29.7% |
| Basques | 93.0 /100 | #112 | Exceptional 29.7% |
| Scandinavians | 92.7 /100 | #113 | Exceptional 29.8% |
| Immigrants | Croatia | 92.6 /100 | #114 | Exceptional 29.8% |
| Ethiopians | 91.9 /100 | #115 | Exceptional 29.8% |
| Immigrants | Italy | 91.7 /100 | #116 | Exceptional 29.9% |