Lithuanian vs Vietnamese Average Family Size
COMPARE
Lithuanian
Vietnamese
Average Family Size
Average Family Size Comparison
Lithuanians
Vietnamese
3.10
AVERAGE FAMILY SIZE
0.0/ 100
METRIC RATING
334th/ 347
METRIC RANK
3.37
AVERAGE FAMILY SIZE
100.0/ 100
METRIC RATING
47th/ 347
METRIC RANK
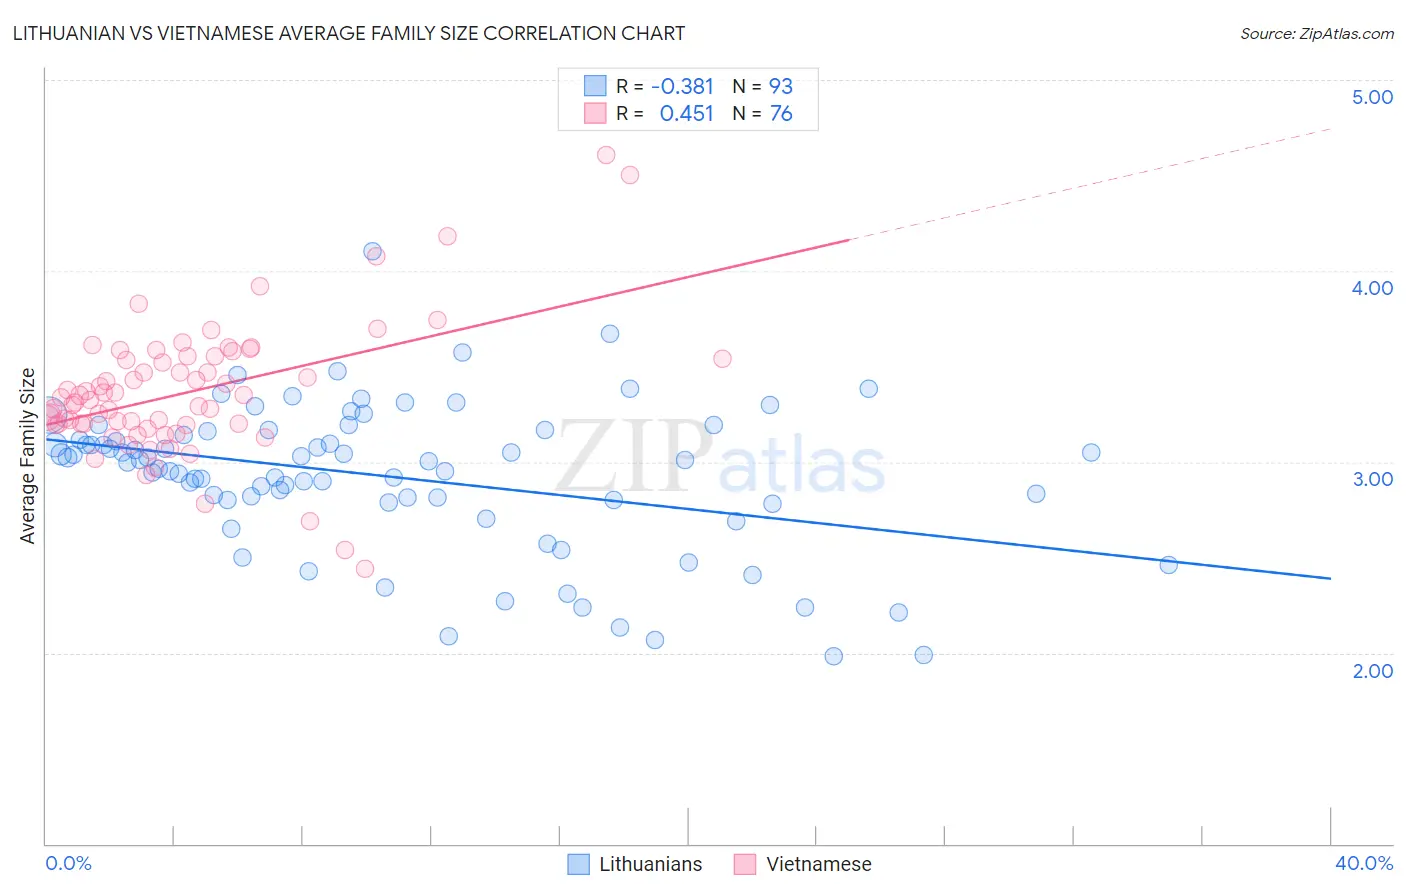
Lithuanian vs Vietnamese Average Family Size Correlation Chart
The statistical analysis conducted on geographies consisting of 421,743,264 people shows a mild negative correlation between the proportion of Lithuanians and average family size in the United States with a correlation coefficient (R) of -0.381 and weighted average of 3.10. Similarly, the statistical analysis conducted on geographies consisting of 170,658,830 people shows a moderate positive correlation between the proportion of Vietnamese and average family size in the United States with a correlation coefficient (R) of 0.451 and weighted average of 3.37, a difference of 8.6%.
Average Family Size Correlation Summary
| Measurement | Lithuanian | Vietnamese |
| Minimum | 1.98 | 2.44 |
| Maximum | 4.10 | 4.61 |
| Range | 2.12 | 2.17 |
| Mean | 2.92 | 3.36 |
| Median | 3.00 | 3.33 |
| Interquartile 25% (IQ1) | 2.79 | 3.20 |
| Interquartile 75% (IQ3) | 3.15 | 3.54 |
| Interquartile Range (IQR) | 0.36 | 0.35 |
| Standard Deviation (Sample) | 0.39 | 0.35 |
| Standard Deviation (Population) | 0.38 | 0.35 |
Similar Demographics by Average Family Size
Demographics Similar to Lithuanians by Average Family Size
In terms of average family size, the demographic groups most similar to Lithuanians are Estonian (3.10, a difference of 0.0%), Luxembourger (3.10, a difference of 0.030%), Scotch-Irish (3.11, a difference of 0.050%), Scottish (3.11, a difference of 0.050%), and Latvian (3.11, a difference of 0.060%).
| Demographics | Rating | Rank | Average Family Size |
| Dutch | 0.0 /100 | #327 | Tragic 3.11 |
| Czechs | 0.0 /100 | #328 | Tragic 3.11 |
| Belgians | 0.0 /100 | #329 | Tragic 3.11 |
| Latvians | 0.0 /100 | #330 | Tragic 3.11 |
| Scotch-Irish | 0.0 /100 | #331 | Tragic 3.11 |
| Scottish | 0.0 /100 | #332 | Tragic 3.11 |
| Estonians | 0.0 /100 | #333 | Tragic 3.10 |
| Lithuanians | 0.0 /100 | #334 | Tragic 3.10 |
| Luxembourgers | 0.0 /100 | #335 | Tragic 3.10 |
| Irish | 0.0 /100 | #336 | Tragic 3.10 |
| Swedes | 0.0 /100 | #337 | Tragic 3.10 |
| French | 0.0 /100 | #338 | Tragic 3.10 |
| Croatians | 0.0 /100 | #339 | Tragic 3.10 |
| Finns | 0.0 /100 | #340 | Tragic 3.09 |
| Poles | 0.0 /100 | #341 | Tragic 3.09 |
Demographics Similar to Vietnamese by Average Family Size
In terms of average family size, the demographic groups most similar to Vietnamese are Immigrants from Nicaragua (3.37, a difference of 0.0%), Haitian (3.37, a difference of 0.040%), Bangladeshi (3.37, a difference of 0.070%), Shoshone (3.37, a difference of 0.10%), and Alaska Native (3.37, a difference of 0.13%).
| Demographics | Rating | Rank | Average Family Size |
| Belizeans | 100.0 /100 | #40 | Exceptional 3.39 |
| Marshallese | 100.0 /100 | #41 | Exceptional 3.38 |
| Immigrants | Vietnam | 100.0 /100 | #42 | Exceptional 3.38 |
| Immigrants | Philippines | 100.0 /100 | #43 | Exceptional 3.37 |
| Alaska Natives | 100.0 /100 | #44 | Exceptional 3.37 |
| Shoshone | 100.0 /100 | #45 | Exceptional 3.37 |
| Haitians | 100.0 /100 | #46 | Exceptional 3.37 |
| Vietnamese | 100.0 /100 | #47 | Exceptional 3.37 |
| Immigrants | Nicaragua | 100.0 /100 | #48 | Exceptional 3.37 |
| Bangladeshis | 100.0 /100 | #49 | Exceptional 3.37 |
| Immigrants | Bangladesh | 100.0 /100 | #50 | Exceptional 3.36 |
| Nicaraguans | 100.0 /100 | #51 | Exceptional 3.36 |
| Fijians | 100.0 /100 | #52 | Exceptional 3.36 |
| Koreans | 100.0 /100 | #53 | Exceptional 3.36 |
| Immigrants | South Eastern Asia | 100.0 /100 | #54 | Exceptional 3.36 |