Lithuanian vs Immigrants from Kenya Male Disability
COMPARE
Lithuanian
Immigrants from Kenya
Male Disability
Male Disability Comparison
Lithuanians
Immigrants from Kenya
11.6%
MALE DISABILITY
6.6/ 100
METRIC RATING
214th/ 347
METRIC RANK
11.1%
MALE DISABILITY
63.8/ 100
METRIC RATING
163rd/ 347
METRIC RANK
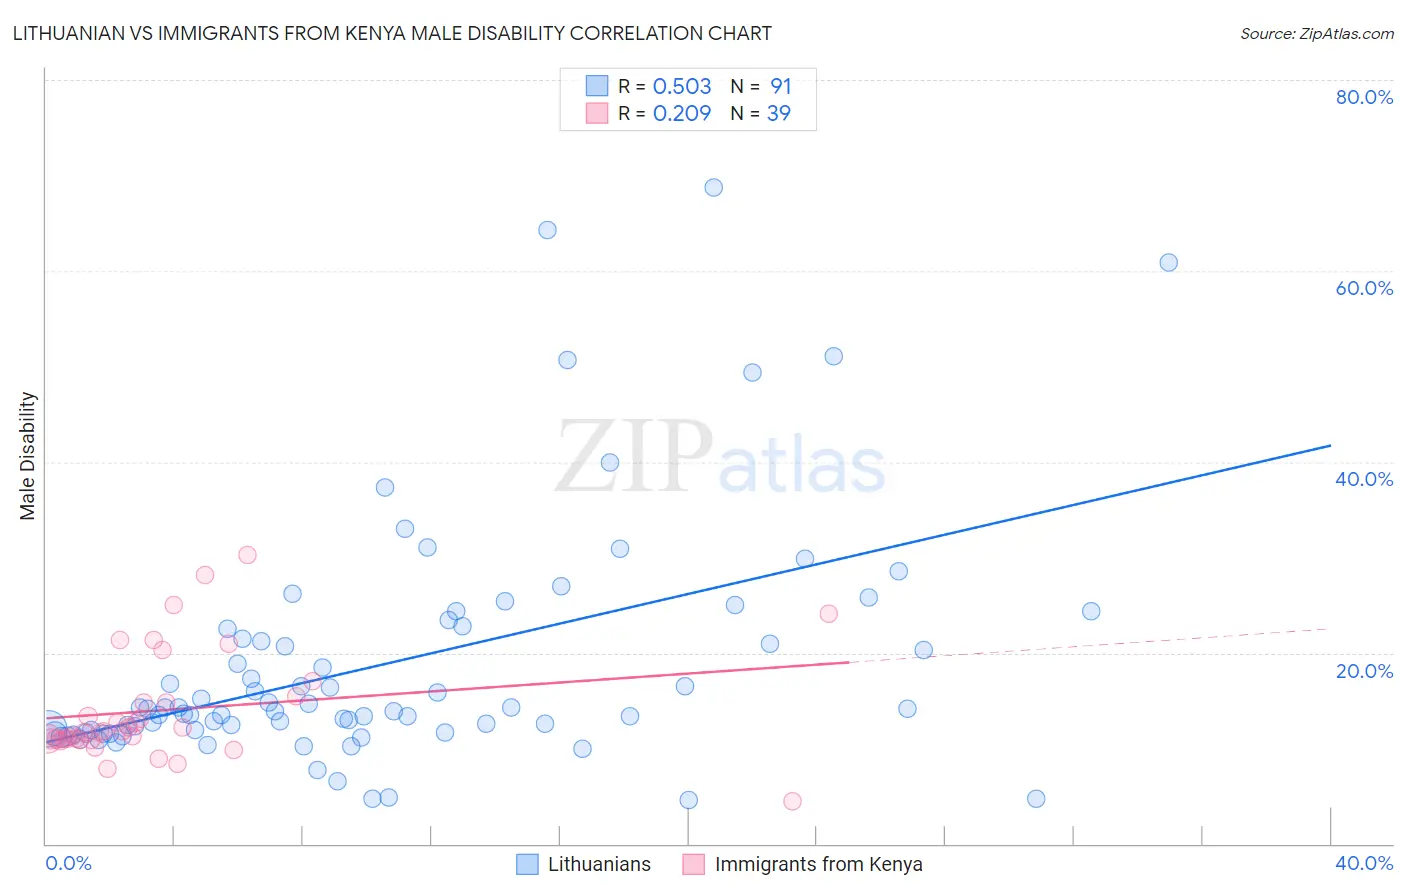
Lithuanian vs Immigrants from Kenya Male Disability Correlation Chart
The statistical analysis conducted on geographies consisting of 421,914,182 people shows a substantial positive correlation between the proportion of Lithuanians and percentage of males with a disability in the United States with a correlation coefficient (R) of 0.503 and weighted average of 11.6%. Similarly, the statistical analysis conducted on geographies consisting of 218,057,071 people shows a weak positive correlation between the proportion of Immigrants from Kenya and percentage of males with a disability in the United States with a correlation coefficient (R) of 0.209 and weighted average of 11.1%, a difference of 4.5%.
Male Disability Correlation Summary
| Measurement | Lithuanian | Immigrants from Kenya |
| Minimum | 4.5% | 4.4% |
| Maximum | 68.7% | 30.3% |
| Range | 64.1% | 25.8% |
| Mean | 18.8% | 14.0% |
| Median | 14.1% | 11.8% |
| Interquartile 25% (IQ1) | 11.6% | 11.0% |
| Interquartile 75% (IQ3) | 22.5% | 15.4% |
| Interquartile Range (IQR) | 10.9% | 4.4% |
| Standard Deviation (Sample) | 12.6% | 5.7% |
| Standard Deviation (Population) | 12.5% | 5.7% |
Similar Demographics by Male Disability
Demographics Similar to Lithuanians by Male Disability
In terms of male disability, the demographic groups most similar to Lithuanians are Indonesian (11.6%, a difference of 0.16%), Mexican American Indian (11.6%, a difference of 0.24%), Immigrants from Scotland (11.6%, a difference of 0.32%), Immigrants from Thailand (11.6%, a difference of 0.35%), and Immigrants from Dominican Republic (11.7%, a difference of 0.44%).
| Demographics | Rating | Rank | Male Disability |
| Immigrants | Somalia | 10.4 /100 | #207 | Poor 11.5% |
| Icelanders | 10.1 /100 | #208 | Poor 11.6% |
| Spanish American Indians | 10.1 /100 | #209 | Poor 11.6% |
| Ute | 9.4 /100 | #210 | Tragic 11.6% |
| Immigrants | Thailand | 8.4 /100 | #211 | Tragic 11.6% |
| Immigrants | Scotland | 8.2 /100 | #212 | Tragic 11.6% |
| Mexican American Indians | 7.8 /100 | #213 | Tragic 11.6% |
| Lithuanians | 6.6 /100 | #214 | Tragic 11.6% |
| Indonesians | 5.9 /100 | #215 | Tragic 11.6% |
| Immigrants | Dominican Republic | 4.9 /100 | #216 | Tragic 11.7% |
| Immigrants | Dominica | 4.6 /100 | #217 | Tragic 11.7% |
| Immigrants | England | 4.0 /100 | #218 | Tragic 11.7% |
| Panamanians | 3.8 /100 | #219 | Tragic 11.7% |
| Immigrants | Western Europe | 3.8 /100 | #220 | Tragic 11.7% |
| Immigrants | Congo | 3.7 /100 | #221 | Tragic 11.7% |
Demographics Similar to Immigrants from Kenya by Male Disability
In terms of male disability, the demographic groups most similar to Immigrants from Kenya are British West Indian (11.1%, a difference of 0.060%), Immigrants from Haiti (11.1%, a difference of 0.090%), Luxembourger (11.1%, a difference of 0.11%), Immigrants from West Indies (11.1%, a difference of 0.12%), and Immigrants from Hungary (11.1%, a difference of 0.15%).
| Demographics | Rating | Rank | Male Disability |
| Russians | 69.8 /100 | #156 | Good 11.1% |
| Immigrants | Western Africa | 69.2 /100 | #157 | Good 11.1% |
| Latvians | 68.1 /100 | #158 | Good 11.1% |
| Guatemalans | 67.2 /100 | #159 | Good 11.1% |
| Albanians | 66.5 /100 | #160 | Good 11.1% |
| Immigrants | West Indies | 65.7 /100 | #161 | Good 11.1% |
| Immigrants | Haiti | 65.3 /100 | #162 | Good 11.1% |
| Immigrants | Kenya | 63.8 /100 | #163 | Good 11.1% |
| British West Indians | 62.8 /100 | #164 | Good 11.1% |
| Luxembourgers | 61.9 /100 | #165 | Good 11.1% |
| Immigrants | Hungary | 61.2 /100 | #166 | Good 11.1% |
| Immigrants | Southern Europe | 54.4 /100 | #167 | Average 11.2% |
| Immigrants | Latin America | 54.0 /100 | #168 | Average 11.2% |
| Barbadians | 53.4 /100 | #169 | Average 11.2% |
| New Zealanders | 52.9 /100 | #170 | Average 11.2% |