Lithuanian vs Immigrants from Moldova Average Family Size
COMPARE
Lithuanian
Immigrants from Moldova
Average Family Size
Average Family Size Comparison
Lithuanians
Immigrants from Moldova
3.10
AVERAGE FAMILY SIZE
0.0/ 100
METRIC RATING
334th/ 347
METRIC RANK
3.18
AVERAGE FAMILY SIZE
2.9/ 100
METRIC RATING
243rd/ 347
METRIC RANK
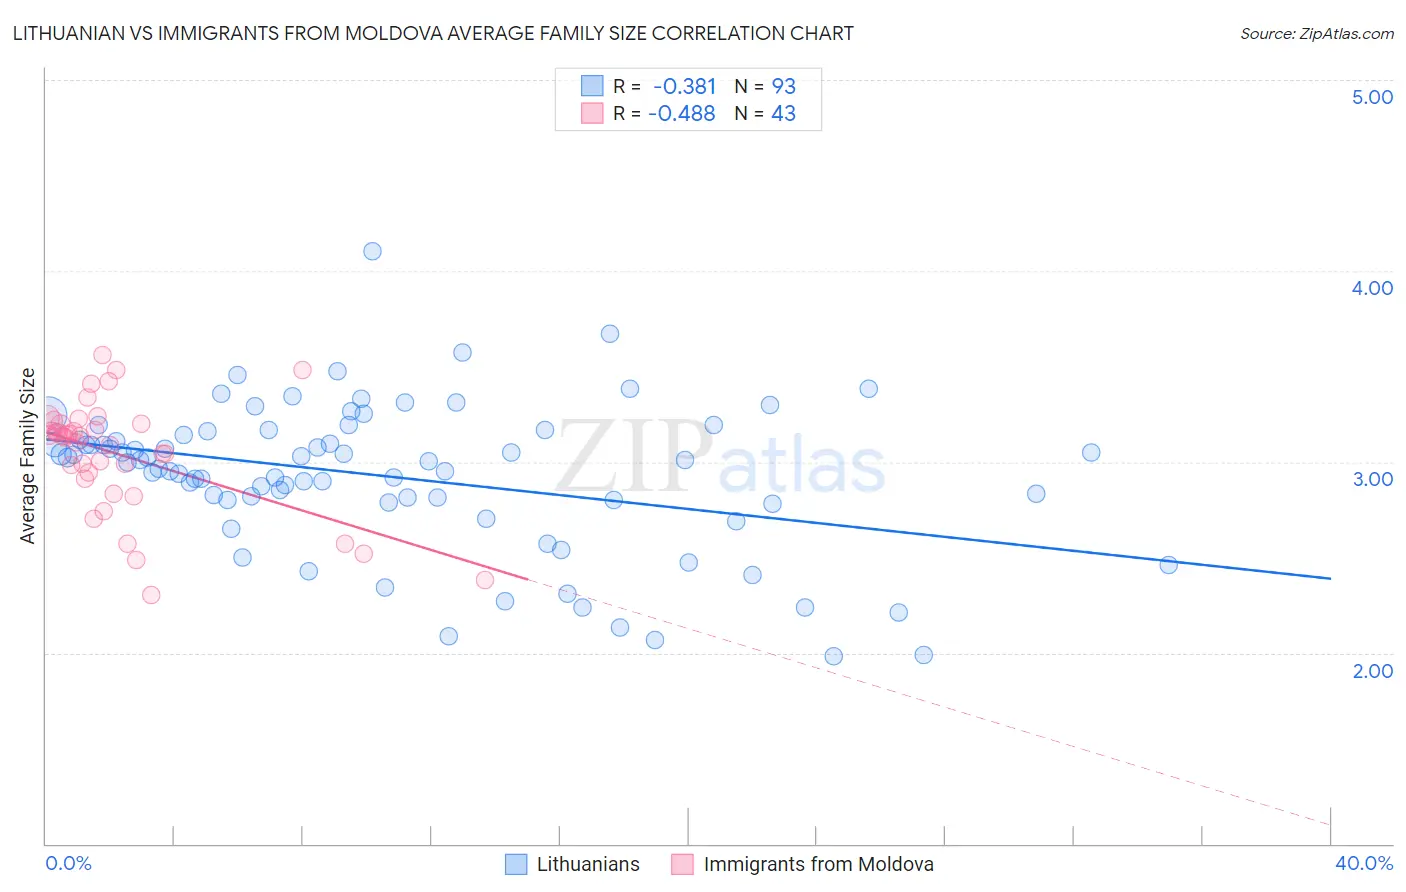
Lithuanian vs Immigrants from Moldova Average Family Size Correlation Chart
The statistical analysis conducted on geographies consisting of 421,743,264 people shows a mild negative correlation between the proportion of Lithuanians and average family size in the United States with a correlation coefficient (R) of -0.381 and weighted average of 3.10. Similarly, the statistical analysis conducted on geographies consisting of 124,363,893 people shows a moderate negative correlation between the proportion of Immigrants from Moldova and average family size in the United States with a correlation coefficient (R) of -0.488 and weighted average of 3.18, a difference of 2.4%.
Average Family Size Correlation Summary
| Measurement | Lithuanian | Immigrants from Moldova |
| Minimum | 1.98 | 2.30 |
| Maximum | 4.10 | 3.56 |
| Range | 2.12 | 1.26 |
| Mean | 2.92 | 3.04 |
| Median | 3.00 | 3.13 |
| Interquartile 25% (IQ1) | 2.79 | 2.91 |
| Interquartile 75% (IQ3) | 3.15 | 3.20 |
| Interquartile Range (IQR) | 0.36 | 0.29 |
| Standard Deviation (Sample) | 0.39 | 0.30 |
| Standard Deviation (Population) | 0.38 | 0.29 |
Similar Demographics by Average Family Size
Demographics Similar to Lithuanians by Average Family Size
In terms of average family size, the demographic groups most similar to Lithuanians are Estonian (3.10, a difference of 0.0%), Luxembourger (3.10, a difference of 0.030%), Scotch-Irish (3.11, a difference of 0.050%), Scottish (3.11, a difference of 0.050%), and Latvian (3.11, a difference of 0.060%).
| Demographics | Rating | Rank | Average Family Size |
| Dutch | 0.0 /100 | #327 | Tragic 3.11 |
| Czechs | 0.0 /100 | #328 | Tragic 3.11 |
| Belgians | 0.0 /100 | #329 | Tragic 3.11 |
| Latvians | 0.0 /100 | #330 | Tragic 3.11 |
| Scotch-Irish | 0.0 /100 | #331 | Tragic 3.11 |
| Scottish | 0.0 /100 | #332 | Tragic 3.11 |
| Estonians | 0.0 /100 | #333 | Tragic 3.10 |
| Lithuanians | 0.0 /100 | #334 | Tragic 3.10 |
| Luxembourgers | 0.0 /100 | #335 | Tragic 3.10 |
| Irish | 0.0 /100 | #336 | Tragic 3.10 |
| Swedes | 0.0 /100 | #337 | Tragic 3.10 |
| French | 0.0 /100 | #338 | Tragic 3.10 |
| Croatians | 0.0 /100 | #339 | Tragic 3.10 |
| Finns | 0.0 /100 | #340 | Tragic 3.09 |
| Poles | 0.0 /100 | #341 | Tragic 3.09 |
Demographics Similar to Immigrants from Moldova by Average Family Size
In terms of average family size, the demographic groups most similar to Immigrants from Moldova are Hungarian (3.18, a difference of 0.0%), Immigrants from Southern Europe (3.18, a difference of 0.010%), Immigrants from Japan (3.18, a difference of 0.020%), Osage (3.18, a difference of 0.040%), and Immigrants from Brazil (3.18, a difference of 0.040%).
| Demographics | Rating | Rank | Average Family Size |
| Immigrants | Portugal | 4.2 /100 | #236 | Tragic 3.18 |
| Immigrants | Romania | 3.7 /100 | #237 | Tragic 3.18 |
| Romanians | 3.7 /100 | #238 | Tragic 3.18 |
| Houma | 3.4 /100 | #239 | Tragic 3.18 |
| Osage | 3.2 /100 | #240 | Tragic 3.18 |
| Immigrants | Japan | 3.0 /100 | #241 | Tragic 3.18 |
| Hungarians | 3.0 /100 | #242 | Tragic 3.18 |
| Immigrants | Moldova | 2.9 /100 | #243 | Tragic 3.18 |
| Immigrants | Southern Europe | 2.9 /100 | #244 | Tragic 3.18 |
| Immigrants | Brazil | 2.7 /100 | #245 | Tragic 3.18 |
| Danes | 2.5 /100 | #246 | Tragic 3.17 |
| Cajuns | 2.4 /100 | #247 | Tragic 3.17 |
| Immigrants | Belarus | 2.3 /100 | #248 | Tragic 3.17 |
| Immigrants | Eastern Europe | 2.1 /100 | #249 | Tragic 3.17 |
| Puget Sound Salish | 1.9 /100 | #250 | Tragic 3.17 |