Lithuanian vs Tsimshian Average Family Size
COMPARE
Lithuanian
Tsimshian
Average Family Size
Average Family Size Comparison
Lithuanians
Tsimshian
3.10
AVERAGE FAMILY SIZE
0.0/ 100
METRIC RATING
334th/ 347
METRIC RANK
3.25
AVERAGE FAMILY SIZE
80.2/ 100
METRIC RATING
144th/ 347
METRIC RANK
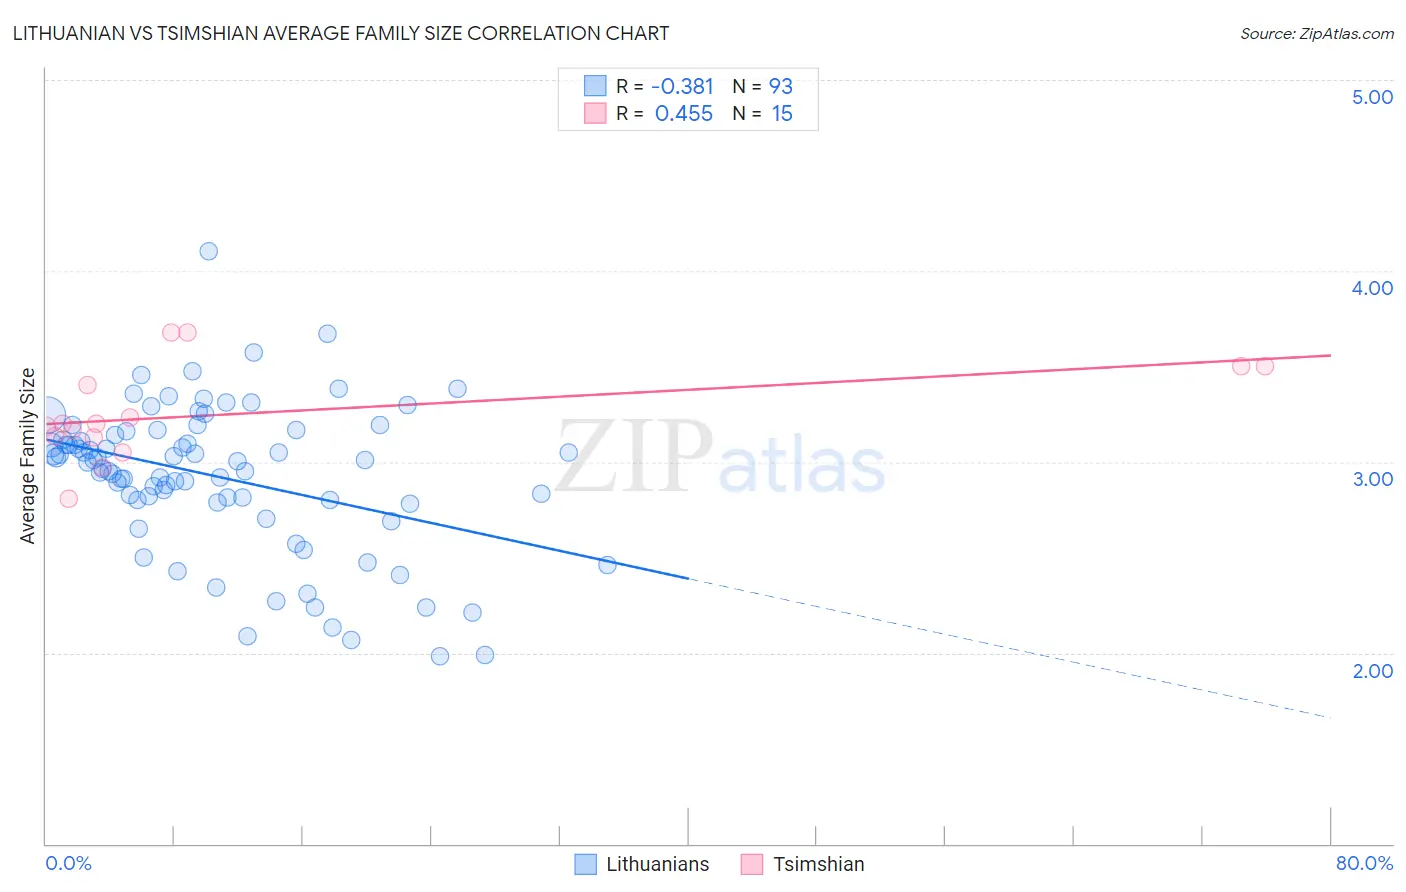
Lithuanian vs Tsimshian Average Family Size Correlation Chart
The statistical analysis conducted on geographies consisting of 421,743,264 people shows a mild negative correlation between the proportion of Lithuanians and average family size in the United States with a correlation coefficient (R) of -0.381 and weighted average of 3.10. Similarly, the statistical analysis conducted on geographies consisting of 15,626,544 people shows a moderate positive correlation between the proportion of Tsimshian and average family size in the United States with a correlation coefficient (R) of 0.455 and weighted average of 3.25, a difference of 4.7%.
Average Family Size Correlation Summary
| Measurement | Lithuanian | Tsimshian |
| Minimum | 1.98 | 2.80 |
| Maximum | 4.10 | 3.68 |
| Range | 2.12 | 0.88 |
| Mean | 2.92 | 3.26 |
| Median | 3.00 | 3.20 |
| Interquartile 25% (IQ1) | 2.79 | 3.13 |
| Interquartile 75% (IQ3) | 3.15 | 3.50 |
| Interquartile Range (IQR) | 0.36 | 0.37 |
| Standard Deviation (Sample) | 0.39 | 0.25 |
| Standard Deviation (Population) | 0.38 | 0.24 |
Similar Demographics by Average Family Size
Demographics Similar to Lithuanians by Average Family Size
In terms of average family size, the demographic groups most similar to Lithuanians are Estonian (3.10, a difference of 0.0%), Luxembourger (3.10, a difference of 0.030%), Scotch-Irish (3.11, a difference of 0.050%), Scottish (3.11, a difference of 0.050%), and Latvian (3.11, a difference of 0.060%).
| Demographics | Rating | Rank | Average Family Size |
| Dutch | 0.0 /100 | #327 | Tragic 3.11 |
| Czechs | 0.0 /100 | #328 | Tragic 3.11 |
| Belgians | 0.0 /100 | #329 | Tragic 3.11 |
| Latvians | 0.0 /100 | #330 | Tragic 3.11 |
| Scotch-Irish | 0.0 /100 | #331 | Tragic 3.11 |
| Scottish | 0.0 /100 | #332 | Tragic 3.11 |
| Estonians | 0.0 /100 | #333 | Tragic 3.10 |
| Lithuanians | 0.0 /100 | #334 | Tragic 3.10 |
| Luxembourgers | 0.0 /100 | #335 | Tragic 3.10 |
| Irish | 0.0 /100 | #336 | Tragic 3.10 |
| Swedes | 0.0 /100 | #337 | Tragic 3.10 |
| French | 0.0 /100 | #338 | Tragic 3.10 |
| Croatians | 0.0 /100 | #339 | Tragic 3.10 |
| Finns | 0.0 /100 | #340 | Tragic 3.09 |
| Poles | 0.0 /100 | #341 | Tragic 3.09 |
Demographics Similar to Tsimshian by Average Family Size
In terms of average family size, the demographic groups most similar to Tsimshian are Bhutanese (3.25, a difference of 0.020%), Liberian (3.25, a difference of 0.030%), Immigrants from Ethiopia (3.25, a difference of 0.040%), Subsaharan African (3.25, a difference of 0.040%), and Venezuelan (3.25, a difference of 0.040%).
| Demographics | Rating | Rank | Average Family Size |
| Immigrants | Middle Africa | 82.4 /100 | #137 | Excellent 3.25 |
| Cubans | 81.8 /100 | #138 | Excellent 3.25 |
| Immigrants | Ethiopia | 81.6 /100 | #139 | Excellent 3.25 |
| Sub-Saharan Africans | 81.6 /100 | #140 | Excellent 3.25 |
| Venezuelans | 81.4 /100 | #141 | Excellent 3.25 |
| Liberians | 81.2 /100 | #142 | Excellent 3.25 |
| Bhutanese | 81.0 /100 | #143 | Excellent 3.25 |
| Tsimshian | 80.2 /100 | #144 | Excellent 3.25 |
| Armenians | 78.2 /100 | #145 | Good 3.25 |
| Immigrants | Africa | 77.9 /100 | #146 | Good 3.25 |
| Immigrants | Jordan | 75.7 /100 | #147 | Good 3.24 |
| Blackfeet | 75.0 /100 | #148 | Good 3.24 |
| Assyrians/Chaldeans/Syriacs | 73.8 /100 | #149 | Good 3.24 |
| Indians (Asian) | 73.6 /100 | #150 | Good 3.24 |
| Jordanians | 73.5 /100 | #151 | Good 3.24 |