Lithuanian vs Central American Family Households with Children
COMPARE
Lithuanian
Central American
Family Households with Children
Family Households with Children Comparison
Lithuanians
Central Americans
26.6%
FAMILY HOUSEHOLDS WITH CHILDREN
0.3/ 100
METRIC RATING
281st/ 347
METRIC RANK
29.1%
FAMILY HOUSEHOLDS WITH CHILDREN
100.0/ 100
METRIC RATING
40th/ 347
METRIC RANK
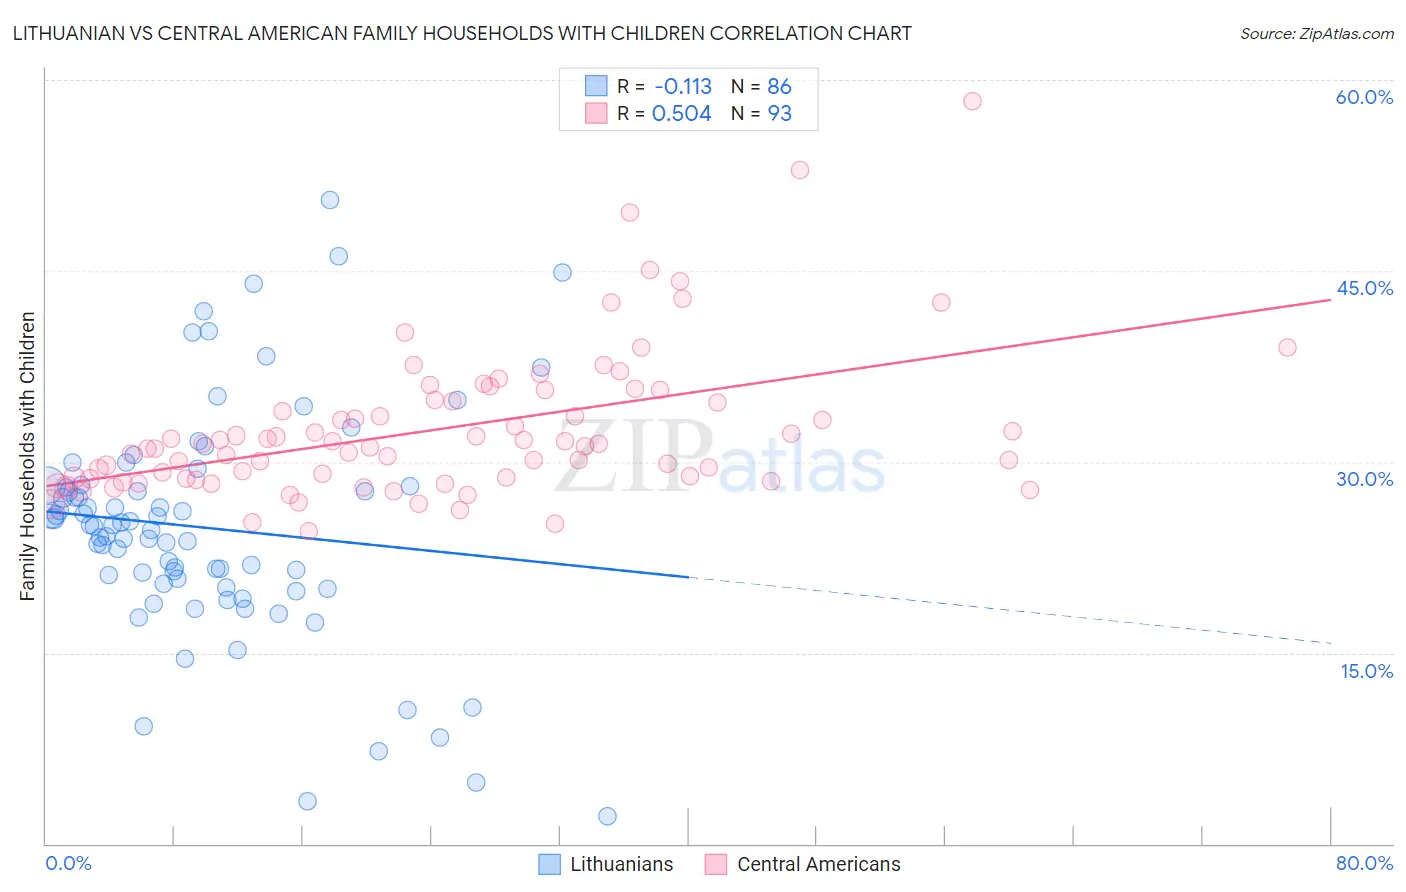
Lithuanian vs Central American Family Households with Children Correlation Chart
The statistical analysis conducted on geographies consisting of 421,521,006 people shows a poor negative correlation between the proportion of Lithuanians and percentage of family households with children in the United States with a correlation coefficient (R) of -0.113 and weighted average of 26.6%. Similarly, the statistical analysis conducted on geographies consisting of 503,865,600 people shows a substantial positive correlation between the proportion of Central Americans and percentage of family households with children in the United States with a correlation coefficient (R) of 0.504 and weighted average of 29.1%, a difference of 9.6%.
Family Households with Children Correlation Summary
| Measurement | Lithuanian | Central American |
| Minimum | 2.2% | 24.5% |
| Maximum | 50.6% | 58.3% |
| Range | 48.4% | 33.8% |
| Mean | 24.8% | 32.6% |
| Median | 25.0% | 31.2% |
| Interquartile 25% (IQ1) | 20.4% | 28.7% |
| Interquartile 75% (IQ3) | 28.1% | 34.8% |
| Interquartile Range (IQR) | 7.7% | 6.1% |
| Standard Deviation (Sample) | 9.1% | 5.8% |
| Standard Deviation (Population) | 9.0% | 5.8% |
Similar Demographics by Family Households with Children
Demographics Similar to Lithuanians by Family Households with Children
In terms of family households with children, the demographic groups most similar to Lithuanians are French American Indian (26.6%, a difference of 0.010%), Immigrants from North America (26.6%, a difference of 0.080%), Senegalese (26.6%, a difference of 0.090%), Immigrants from Canada (26.5%, a difference of 0.10%), and Finnish (26.6%, a difference of 0.12%).
| Demographics | Rating | Rank | Family Households with Children |
| Eastern Europeans | 0.6 /100 | #274 | Tragic 26.7% |
| Immigrants | Northern Europe | 0.5 /100 | #275 | Tragic 26.7% |
| Immigrants | Spain | 0.5 /100 | #276 | Tragic 26.6% |
| Celtics | 0.4 /100 | #277 | Tragic 26.6% |
| Immigrants | Europe | 0.4 /100 | #278 | Tragic 26.6% |
| Finns | 0.4 /100 | #279 | Tragic 26.6% |
| Senegalese | 0.4 /100 | #280 | Tragic 26.6% |
| Lithuanians | 0.3 /100 | #281 | Tragic 26.6% |
| French American Indians | 0.3 /100 | #282 | Tragic 26.6% |
| Immigrants | North America | 0.3 /100 | #283 | Tragic 26.6% |
| Immigrants | Canada | 0.3 /100 | #284 | Tragic 26.5% |
| Cambodians | 0.2 /100 | #285 | Tragic 26.5% |
| Immigrants | Senegal | 0.2 /100 | #286 | Tragic 26.5% |
| Shoshone | 0.2 /100 | #287 | Tragic 26.5% |
| Russians | 0.2 /100 | #288 | Tragic 26.5% |
Demographics Similar to Central Americans by Family Households with Children
In terms of family households with children, the demographic groups most similar to Central Americans are Yaqui (29.1%, a difference of 0.010%), Immigrants from South Eastern Asia (29.1%, a difference of 0.090%), Spanish American Indian (29.1%, a difference of 0.090%), Korean (29.2%, a difference of 0.16%), and Asian (29.1%, a difference of 0.28%).
| Demographics | Rating | Rank | Family Households with Children |
| Venezuelans | 100.0 /100 | #33 | Exceptional 29.4% |
| Immigrants | Bolivia | 100.0 /100 | #34 | Exceptional 29.3% |
| Immigrants | Sierra Leone | 100.0 /100 | #35 | Exceptional 29.3% |
| Immigrants | Venezuela | 100.0 /100 | #36 | Exceptional 29.3% |
| Immigrants | Cameroon | 100.0 /100 | #37 | Exceptional 29.2% |
| Koreans | 100.0 /100 | #38 | Exceptional 29.2% |
| Yaqui | 100.0 /100 | #39 | Exceptional 29.1% |
| Central Americans | 100.0 /100 | #40 | Exceptional 29.1% |
| Immigrants | South Eastern Asia | 100.0 /100 | #41 | Exceptional 29.1% |
| Spanish American Indians | 100.0 /100 | #42 | Exceptional 29.1% |
| Asians | 100.0 /100 | #43 | Exceptional 29.1% |
| Immigrants | Taiwan | 100.0 /100 | #44 | Exceptional 29.0% |
| Fijians | 100.0 /100 | #45 | Exceptional 29.0% |
| Immigrants | Philippines | 100.0 /100 | #46 | Exceptional 29.0% |
| Peruvians | 100.0 /100 | #47 | Exceptional 29.0% |