Scandinavian vs Cree Family Households with Children
COMPARE
Scandinavian
Cree
Family Households with Children
Family Households with Children Comparison
Scandinavians
Cree
28.0%
FAMILY HOUSEHOLDS WITH CHILDREN
97.1/ 100
METRIC RATING
111th/ 347
METRIC RANK
26.2%
FAMILY HOUSEHOLDS WITH CHILDREN
0.0/ 100
METRIC RATING
313th/ 347
METRIC RANK
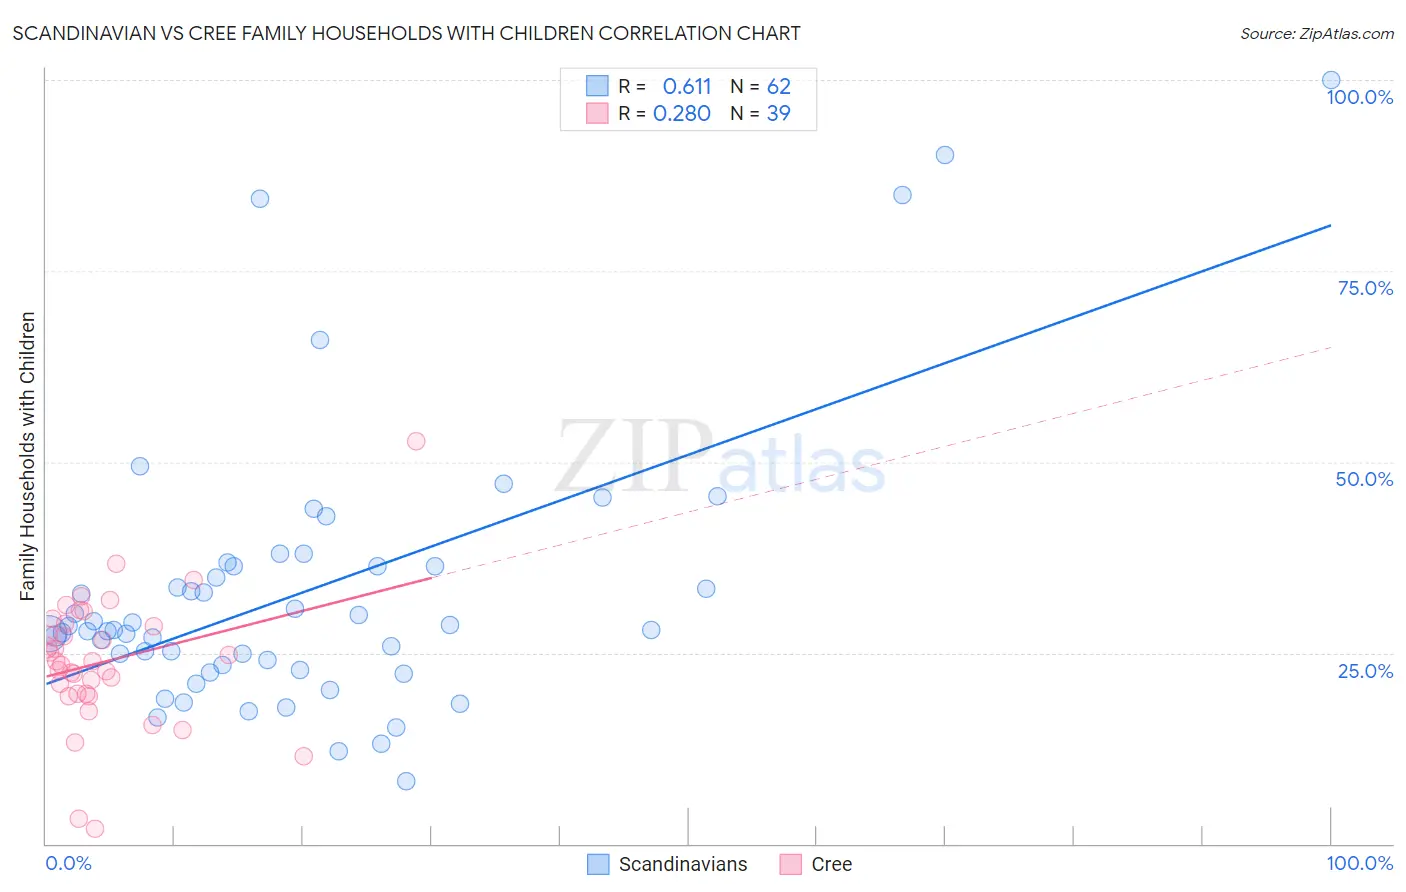
Scandinavian vs Cree Family Households with Children Correlation Chart
The statistical analysis conducted on geographies consisting of 472,042,007 people shows a significant positive correlation between the proportion of Scandinavians and percentage of family households with children in the United States with a correlation coefficient (R) of 0.611 and weighted average of 28.0%. Similarly, the statistical analysis conducted on geographies consisting of 76,201,254 people shows a weak positive correlation between the proportion of Cree and percentage of family households with children in the United States with a correlation coefficient (R) of 0.280 and weighted average of 26.2%, a difference of 7.0%.
Family Households with Children Correlation Summary
| Measurement | Scandinavian | Cree |
| Minimum | 8.1% | 1.9% |
| Maximum | 100.0% | 52.6% |
| Range | 91.9% | 50.7% |
| Mean | 32.9% | 23.9% |
| Median | 28.0% | 23.8% |
| Interquartile 25% (IQ1) | 23.4% | 19.6% |
| Interquartile 75% (IQ3) | 36.4% | 28.8% |
| Interquartile Range (IQR) | 13.0% | 9.2% |
| Standard Deviation (Sample) | 18.1% | 8.8% |
| Standard Deviation (Population) | 17.9% | 8.7% |
Similar Demographics by Family Households with Children
Demographics Similar to Scandinavians by Family Households with Children
In terms of family households with children, the demographic groups most similar to Scandinavians are Immigrants from Middle Africa (28.0%, a difference of 0.030%), Arab (28.0%, a difference of 0.030%), South American Indian (28.0%, a difference of 0.050%), Spaniard (28.0%, a difference of 0.060%), and Immigrants from Africa (28.0%, a difference of 0.060%).
| Demographics | Rating | Rank | Family Households with Children |
| Sioux | 98.3 /100 | #104 | Exceptional 28.1% |
| Choctaw | 98.3 /100 | #105 | Exceptional 28.1% |
| Immigrants | South America | 98.0 /100 | #106 | Exceptional 28.0% |
| Immigrants | Uganda | 97.7 /100 | #107 | Exceptional 28.0% |
| Immigrants | Burma/Myanmar | 97.7 /100 | #108 | Exceptional 28.0% |
| Tohono O'odham | 97.6 /100 | #109 | Exceptional 28.0% |
| Spaniards | 97.4 /100 | #110 | Exceptional 28.0% |
| Scandinavians | 97.1 /100 | #111 | Exceptional 28.0% |
| Immigrants | Middle Africa | 97.0 /100 | #112 | Exceptional 28.0% |
| Arabs | 97.0 /100 | #113 | Exceptional 28.0% |
| South American Indians | 96.9 /100 | #114 | Exceptional 28.0% |
| Immigrants | Africa | 96.8 /100 | #115 | Exceptional 28.0% |
| Pakistanis | 96.0 /100 | #116 | Exceptional 27.9% |
| Immigrants | Malaysia | 95.9 /100 | #117 | Exceptional 27.9% |
| Central American Indians | 95.9 /100 | #118 | Exceptional 27.9% |
Demographics Similar to Cree by Family Households with Children
In terms of family households with children, the demographic groups most similar to Cree are French Canadian (26.1%, a difference of 0.080%), Immigrants from Norway (26.1%, a difference of 0.15%), Estonian (26.1%, a difference of 0.23%), Immigrants from Czechoslovakia (26.2%, a difference of 0.26%), and Colville (26.2%, a difference of 0.32%).
| Demographics | Rating | Rank | Family Households with Children |
| Bermudans | 0.1 /100 | #306 | Tragic 26.3% |
| West Indians | 0.0 /100 | #307 | Tragic 26.3% |
| Lumbee | 0.0 /100 | #308 | Tragic 26.3% |
| Immigrants | Somalia | 0.0 /100 | #309 | Tragic 26.3% |
| Marshallese | 0.0 /100 | #310 | Tragic 26.2% |
| Colville | 0.0 /100 | #311 | Tragic 26.2% |
| Immigrants | Czechoslovakia | 0.0 /100 | #312 | Tragic 26.2% |
| Cree | 0.0 /100 | #313 | Tragic 26.2% |
| French Canadians | 0.0 /100 | #314 | Tragic 26.1% |
| Immigrants | Norway | 0.0 /100 | #315 | Tragic 26.1% |
| Estonians | 0.0 /100 | #316 | Tragic 26.1% |
| Ottawa | 0.0 /100 | #317 | Tragic 26.1% |
| Iroquois | 0.0 /100 | #318 | Tragic 26.1% |
| Immigrants | France | 0.0 /100 | #319 | Tragic 26.0% |
| Tlingit-Haida | 0.0 /100 | #320 | Tragic 26.0% |