Immigrants from Latvia vs Cree Family Households with Children
COMPARE
Immigrants from Latvia
Cree
Family Households with Children
Family Households with Children Comparison
Immigrants from Latvia
Cree
25.9%
FAMILY HOUSEHOLDS WITH CHILDREN
0.0/ 100
METRIC RATING
330th/ 347
METRIC RANK
26.2%
FAMILY HOUSEHOLDS WITH CHILDREN
0.0/ 100
METRIC RATING
313th/ 347
METRIC RANK
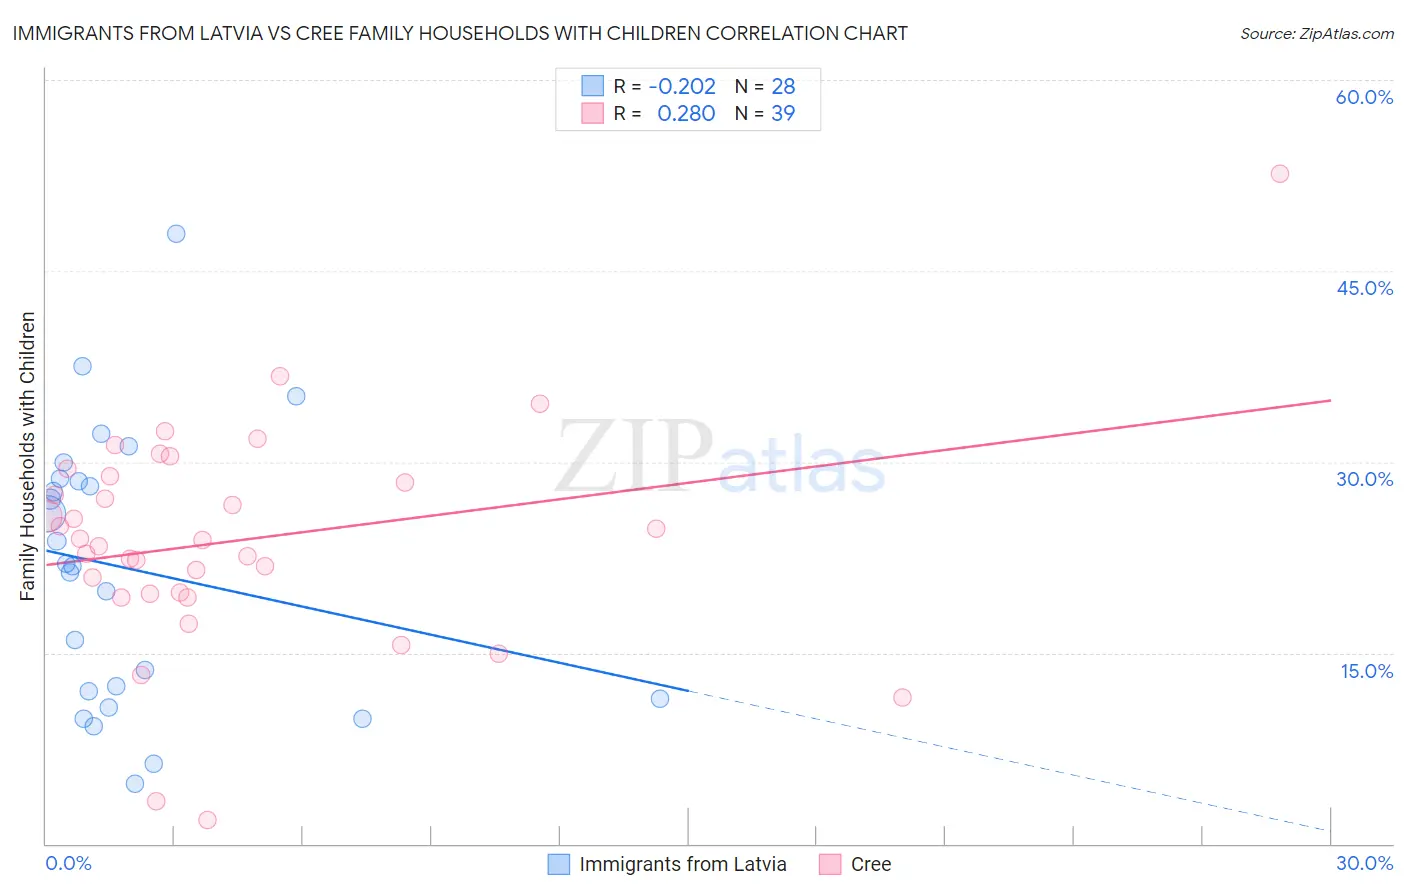
Immigrants from Latvia vs Cree Family Households with Children Correlation Chart
The statistical analysis conducted on geographies consisting of 113,723,252 people shows a weak negative correlation between the proportion of Immigrants from Latvia and percentage of family households with children in the United States with a correlation coefficient (R) of -0.202 and weighted average of 25.9%. Similarly, the statistical analysis conducted on geographies consisting of 76,201,254 people shows a weak positive correlation between the proportion of Cree and percentage of family households with children in the United States with a correlation coefficient (R) of 0.280 and weighted average of 26.2%, a difference of 1.2%.
Family Households with Children Correlation Summary
| Measurement | Immigrants from Latvia | Cree |
| Minimum | 4.7% | 1.9% |
| Maximum | 48.0% | 52.6% |
| Range | 43.3% | 50.7% |
| Mean | 21.6% | 23.9% |
| Median | 21.9% | 23.8% |
| Interquartile 25% (IQ1) | 11.7% | 19.6% |
| Interquartile 75% (IQ3) | 28.6% | 28.8% |
| Interquartile Range (IQR) | 16.9% | 9.2% |
| Standard Deviation (Sample) | 10.7% | 8.8% |
| Standard Deviation (Population) | 10.5% | 8.7% |
Demographics Similar to Immigrants from Latvia and Cree by Family Households with Children
In terms of family households with children, the demographic groups most similar to Immigrants from Latvia are Slovene (25.8%, a difference of 0.13%), Cypriot (25.9%, a difference of 0.18%), Immigrants from Albania (25.9%, a difference of 0.31%), Immigrants from Barbados (26.0%, a difference of 0.41%), and Immigrants from Ireland (26.0%, a difference of 0.52%). Similarly, the demographic groups most similar to Cree are French Canadian (26.1%, a difference of 0.080%), Immigrants from Norway (26.1%, a difference of 0.15%), Estonian (26.1%, a difference of 0.23%), Immigrants from Czechoslovakia (26.2%, a difference of 0.26%), and Colville (26.2%, a difference of 0.32%).
| Demographics | Rating | Rank | Family Households with Children |
| Colville | 0.0 /100 | #311 | Tragic 26.2% |
| Immigrants | Czechoslovakia | 0.0 /100 | #312 | Tragic 26.2% |
| Cree | 0.0 /100 | #313 | Tragic 26.2% |
| French Canadians | 0.0 /100 | #314 | Tragic 26.1% |
| Immigrants | Norway | 0.0 /100 | #315 | Tragic 26.1% |
| Estonians | 0.0 /100 | #316 | Tragic 26.1% |
| Ottawa | 0.0 /100 | #317 | Tragic 26.1% |
| Iroquois | 0.0 /100 | #318 | Tragic 26.1% |
| Immigrants | France | 0.0 /100 | #319 | Tragic 26.0% |
| Tlingit-Haida | 0.0 /100 | #320 | Tragic 26.0% |
| British West Indians | 0.0 /100 | #321 | Tragic 26.0% |
| Immigrants | Greece | 0.0 /100 | #322 | Tragic 26.0% |
| Immigrants | Australia | 0.0 /100 | #323 | Tragic 26.0% |
| Chinese | 0.0 /100 | #324 | Tragic 26.0% |
| Barbadians | 0.0 /100 | #325 | Tragic 26.0% |
| Immigrants | Ireland | 0.0 /100 | #326 | Tragic 26.0% |
| Immigrants | Barbados | 0.0 /100 | #327 | Tragic 26.0% |
| Immigrants | Albania | 0.0 /100 | #328 | Tragic 25.9% |
| Cypriots | 0.0 /100 | #329 | Tragic 25.9% |
| Immigrants | Latvia | 0.0 /100 | #330 | Tragic 25.9% |
| Slovenes | 0.0 /100 | #331 | Tragic 25.8% |