Lithuanian vs Somali Family Households with Children
COMPARE
Lithuanian
Somali
Family Households with Children
Family Households with Children Comparison
Lithuanians
Somalis
26.6%
FAMILY HOUSEHOLDS WITH CHILDREN
0.3/ 100
METRIC RATING
281st/ 347
METRIC RANK
26.7%
FAMILY HOUSEHOLDS WITH CHILDREN
0.7/ 100
METRIC RATING
272nd/ 347
METRIC RANK
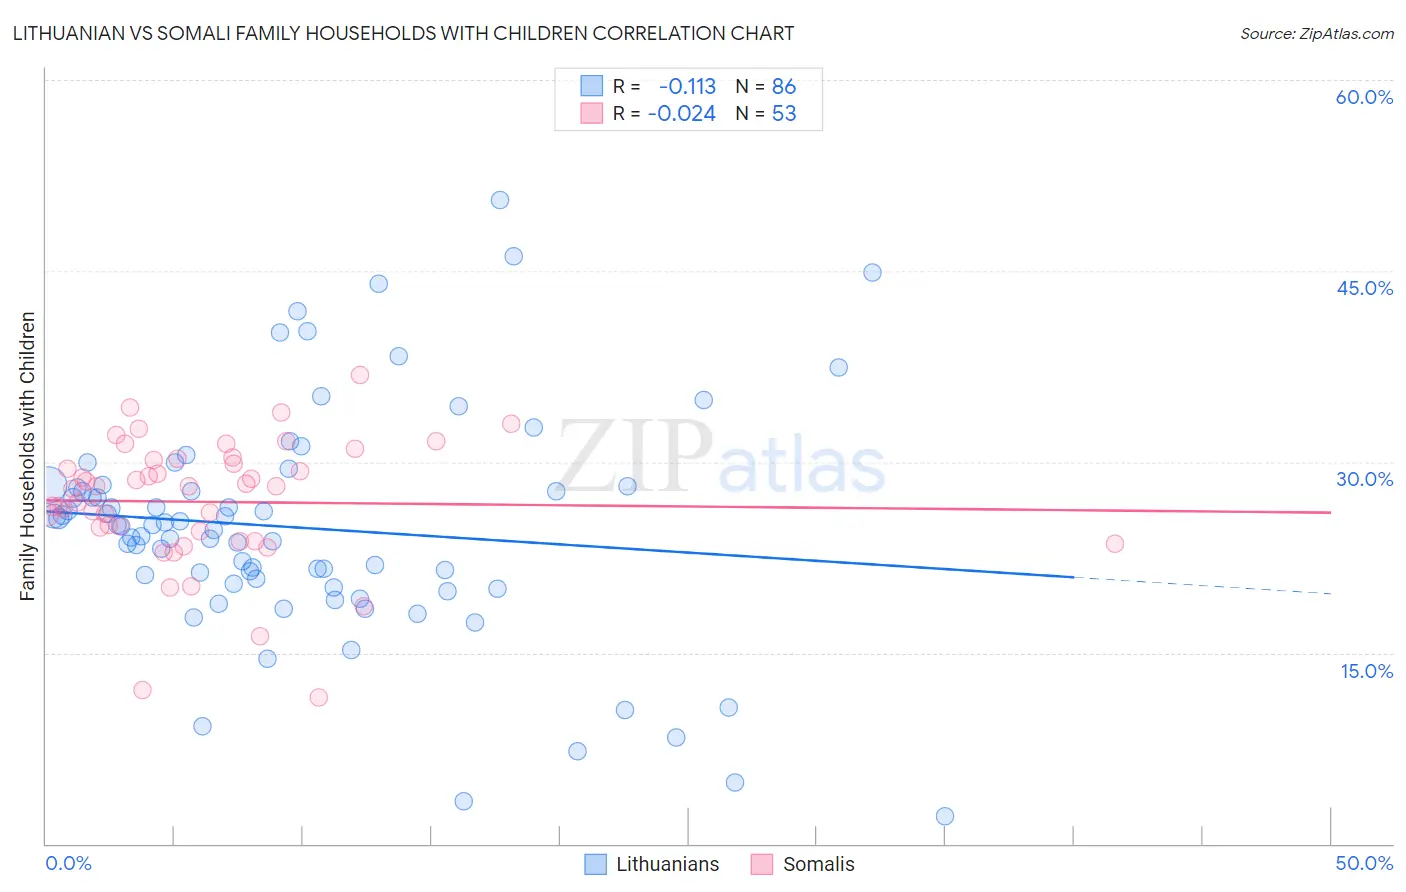
Lithuanian vs Somali Family Households with Children Correlation Chart
The statistical analysis conducted on geographies consisting of 421,521,006 people shows a poor negative correlation between the proportion of Lithuanians and percentage of family households with children in the United States with a correlation coefficient (R) of -0.113 and weighted average of 26.6%. Similarly, the statistical analysis conducted on geographies consisting of 99,290,252 people shows no correlation between the proportion of Somalis and percentage of family households with children in the United States with a correlation coefficient (R) of -0.024 and weighted average of 26.7%, a difference of 0.43%.
Family Households with Children Correlation Summary
| Measurement | Lithuanian | Somali |
| Minimum | 2.2% | 11.5% |
| Maximum | 50.6% | 36.8% |
| Range | 48.4% | 25.3% |
| Mean | 24.8% | 26.9% |
| Median | 25.0% | 28.1% |
| Interquartile 25% (IQ1) | 20.4% | 24.2% |
| Interquartile 75% (IQ3) | 28.1% | 30.2% |
| Interquartile Range (IQR) | 7.7% | 6.1% |
| Standard Deviation (Sample) | 9.1% | 5.0% |
| Standard Deviation (Population) | 9.0% | 5.0% |
Demographics Similar to Lithuanians and Somalis by Family Households with Children
In terms of family households with children, the demographic groups most similar to Lithuanians are French American Indian (26.6%, a difference of 0.010%), Immigrants from North America (26.6%, a difference of 0.080%), Senegalese (26.6%, a difference of 0.090%), Immigrants from Canada (26.5%, a difference of 0.10%), and Finnish (26.6%, a difference of 0.12%). Similarly, the demographic groups most similar to Somalis are Immigrants from Hungary (26.7%, a difference of 0.030%), Eastern European (26.7%, a difference of 0.040%), French (26.7%, a difference of 0.060%), Immigrants from Zaire (26.7%, a difference of 0.080%), and Immigrants from Northern Europe (26.7%, a difference of 0.12%).
| Demographics | Rating | Rank | Family Households with Children |
| Maltese | 0.9 /100 | #266 | Tragic 26.7% |
| Immigrants | Uzbekistan | 0.9 /100 | #267 | Tragic 26.7% |
| Immigrants | Belgium | 0.9 /100 | #268 | Tragic 26.7% |
| Immigrants | Denmark | 0.8 /100 | #269 | Tragic 26.7% |
| Immigrants | Zaire | 0.7 /100 | #270 | Tragic 26.7% |
| French | 0.7 /100 | #271 | Tragic 26.7% |
| Somalis | 0.7 /100 | #272 | Tragic 26.7% |
| Immigrants | Hungary | 0.6 /100 | #273 | Tragic 26.7% |
| Eastern Europeans | 0.6 /100 | #274 | Tragic 26.7% |
| Immigrants | Northern Europe | 0.5 /100 | #275 | Tragic 26.7% |
| Immigrants | Spain | 0.5 /100 | #276 | Tragic 26.6% |
| Celtics | 0.4 /100 | #277 | Tragic 26.6% |
| Immigrants | Europe | 0.4 /100 | #278 | Tragic 26.6% |
| Finns | 0.4 /100 | #279 | Tragic 26.6% |
| Senegalese | 0.4 /100 | #280 | Tragic 26.6% |
| Lithuanians | 0.3 /100 | #281 | Tragic 26.6% |
| French American Indians | 0.3 /100 | #282 | Tragic 26.6% |
| Immigrants | North America | 0.3 /100 | #283 | Tragic 26.6% |
| Immigrants | Canada | 0.3 /100 | #284 | Tragic 26.5% |
| Cambodians | 0.2 /100 | #285 | Tragic 26.5% |
| Immigrants | Senegal | 0.2 /100 | #286 | Tragic 26.5% |