Immigrants from Latvia vs Central American Births to Unmarried Women
COMPARE
Immigrants from Latvia
Central American
Births to Unmarried Women
Births to Unmarried Women Comparison
Immigrants from Latvia
Central Americans
29.1%
BIRTHS TO UNMARRIED WOMEN
96.8/ 100
METRIC RATING
90th/ 347
METRIC RANK
36.7%
BIRTHS TO UNMARRIED WOMEN
0.1/ 100
METRIC RATING
267th/ 347
METRIC RANK
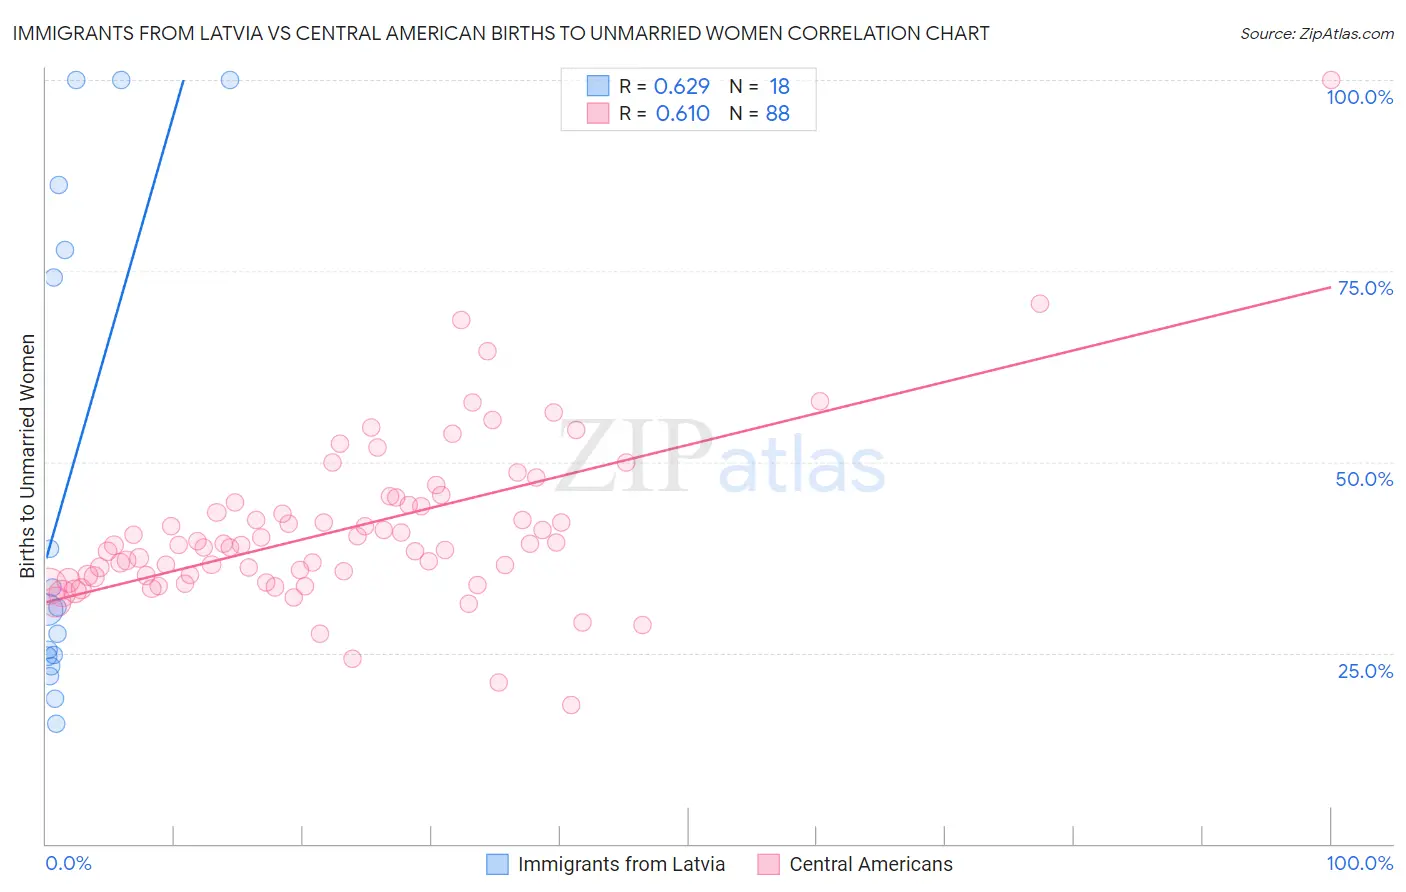
Immigrants from Latvia vs Central American Births to Unmarried Women Correlation Chart
The statistical analysis conducted on geographies consisting of 109,179,125 people shows a significant positive correlation between the proportion of Immigrants from Latvia and percentage of births to unmarried women in the United States with a correlation coefficient (R) of 0.629 and weighted average of 29.1%. Similarly, the statistical analysis conducted on geographies consisting of 464,543,910 people shows a significant positive correlation between the proportion of Central Americans and percentage of births to unmarried women in the United States with a correlation coefficient (R) of 0.610 and weighted average of 36.7%, a difference of 26.1%.
Births to Unmarried Women Correlation Summary
| Measurement | Immigrants from Latvia | Central American |
| Minimum | 15.8% | 18.1% |
| Maximum | 100.0% | 100.0% |
| Range | 84.2% | 81.9% |
| Mean | 47.4% | 41.3% |
| Median | 30.8% | 39.1% |
| Interquartile 25% (IQ1) | 24.5% | 35.0% |
| Interquartile 75% (IQ3) | 77.8% | 44.6% |
| Interquartile Range (IQR) | 53.3% | 9.5% |
| Standard Deviation (Sample) | 31.8% | 11.2% |
| Standard Deviation (Population) | 30.9% | 11.1% |
Similar Demographics by Births to Unmarried Women
Demographics Similar to Immigrants from Latvia by Births to Unmarried Women
In terms of births to unmarried women, the demographic groups most similar to Immigrants from Latvia are Immigrants from Saudi Arabia (29.1%, a difference of 0.16%), Immigrants from Fiji (29.2%, a difference of 0.21%), Arab (29.2%, a difference of 0.25%), Estonian (29.2%, a difference of 0.29%), and Ukrainian (29.2%, a difference of 0.41%).
| Demographics | Rating | Rank | Births to Unmarried Women |
| Immigrants | Kuwait | 98.0 /100 | #83 | Exceptional 28.8% |
| Immigrants | Poland | 97.6 /100 | #84 | Exceptional 28.9% |
| Sri Lankans | 97.5 /100 | #85 | Exceptional 28.9% |
| Immigrants | Jordan | 97.4 /100 | #86 | Exceptional 29.0% |
| Taiwanese | 97.3 /100 | #87 | Exceptional 29.0% |
| Immigrants | France | 97.3 /100 | #88 | Exceptional 29.0% |
| Immigrants | Saudi Arabia | 97.0 /100 | #89 | Exceptional 29.1% |
| Immigrants | Latvia | 96.8 /100 | #90 | Exceptional 29.1% |
| Immigrants | Fiji | 96.6 /100 | #91 | Exceptional 29.2% |
| Arabs | 96.5 /100 | #92 | Exceptional 29.2% |
| Estonians | 96.5 /100 | #93 | Exceptional 29.2% |
| Ukrainians | 96.3 /100 | #94 | Exceptional 29.2% |
| Immigrants | Vietnam | 96.1 /100 | #95 | Exceptional 29.3% |
| Norwegians | 95.8 /100 | #96 | Exceptional 29.3% |
| Immigrants | South Africa | 95.7 /100 | #97 | Exceptional 29.3% |
Demographics Similar to Central Americans by Births to Unmarried Women
In terms of births to unmarried women, the demographic groups most similar to Central Americans are Comanche (36.7%, a difference of 0.010%), Immigrants from Senegal (36.7%, a difference of 0.070%), Cherokee (36.7%, a difference of 0.12%), Senegalese (36.8%, a difference of 0.13%), and Subsaharan African (36.7%, a difference of 0.17%).
| Demographics | Rating | Rank | Births to Unmarried Women |
| Ottawa | 0.2 /100 | #260 | Tragic 36.5% |
| Trinidadians and Tobagonians | 0.2 /100 | #261 | Tragic 36.5% |
| French American Indians | 0.1 /100 | #262 | Tragic 36.6% |
| Nicaraguans | 0.1 /100 | #263 | Tragic 36.6% |
| Sub-Saharan Africans | 0.1 /100 | #264 | Tragic 36.7% |
| Cherokee | 0.1 /100 | #265 | Tragic 36.7% |
| Immigrants | Senegal | 0.1 /100 | #266 | Tragic 36.7% |
| Central Americans | 0.1 /100 | #267 | Tragic 36.7% |
| Comanche | 0.1 /100 | #268 | Tragic 36.7% |
| Senegalese | 0.1 /100 | #269 | Tragic 36.8% |
| Immigrants | Congo | 0.1 /100 | #270 | Tragic 36.8% |
| Immigrants | Barbados | 0.1 /100 | #271 | Tragic 36.8% |
| Choctaw | 0.1 /100 | #272 | Tragic 36.9% |
| Mexicans | 0.1 /100 | #273 | Tragic 36.9% |
| Cree | 0.1 /100 | #274 | Tragic 37.0% |