Immigrants from Italy vs Central American Births to Unmarried Women
COMPARE
Immigrants from Italy
Central American
Births to Unmarried Women
Births to Unmarried Women Comparison
Immigrants from Italy
Central Americans
29.9%
BIRTHS TO UNMARRIED WOMEN
91.7/ 100
METRIC RATING
116th/ 347
METRIC RANK
36.7%
BIRTHS TO UNMARRIED WOMEN
0.1/ 100
METRIC RATING
267th/ 347
METRIC RANK
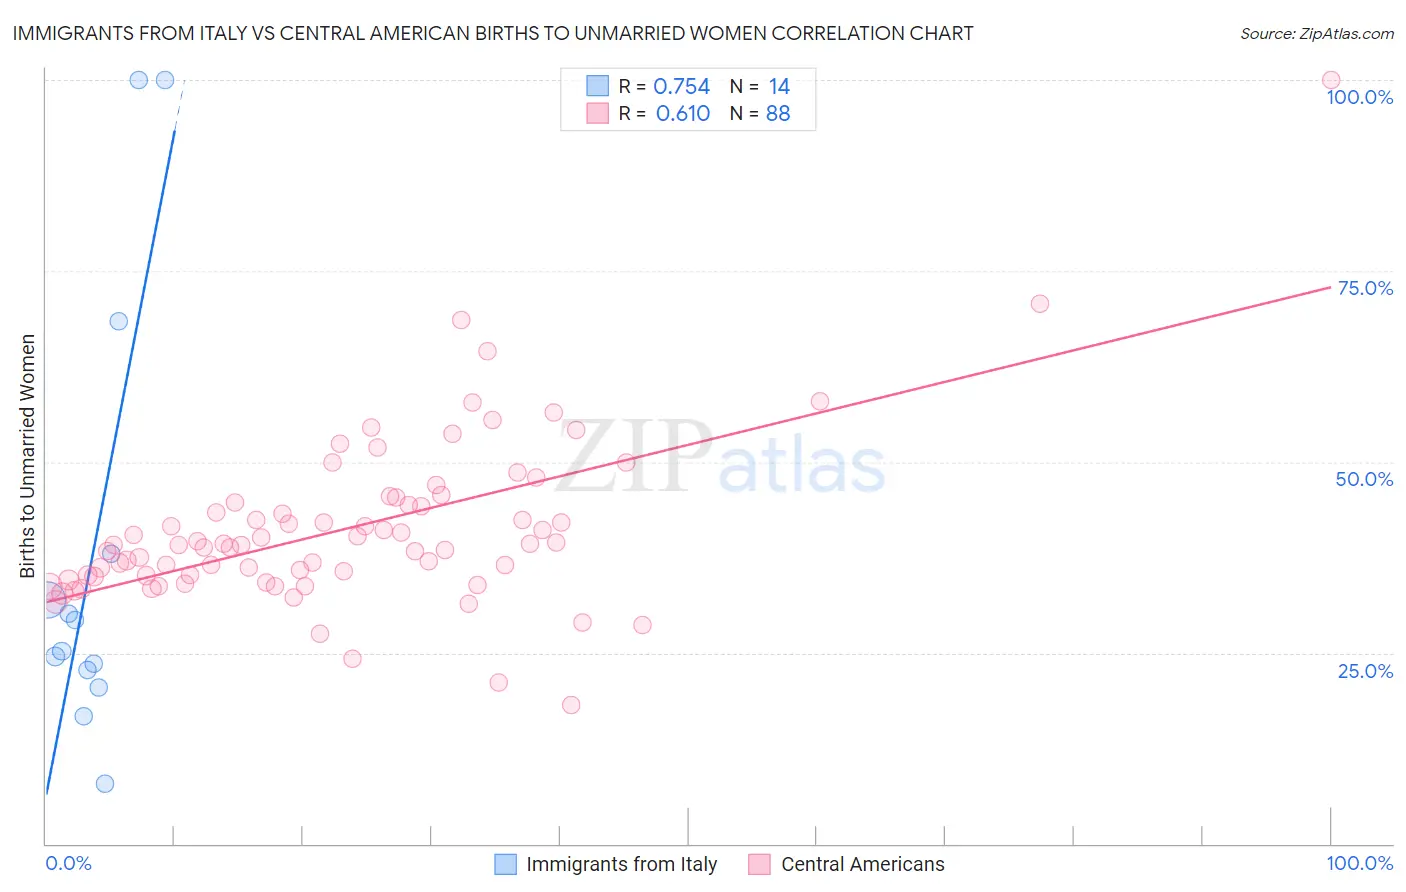
Immigrants from Italy vs Central American Births to Unmarried Women Correlation Chart
The statistical analysis conducted on geographies consisting of 300,581,400 people shows a strong positive correlation between the proportion of Immigrants from Italy and percentage of births to unmarried women in the United States with a correlation coefficient (R) of 0.754 and weighted average of 29.9%. Similarly, the statistical analysis conducted on geographies consisting of 464,543,910 people shows a significant positive correlation between the proportion of Central Americans and percentage of births to unmarried women in the United States with a correlation coefficient (R) of 0.610 and weighted average of 36.7%, a difference of 22.9%.
Births to Unmarried Women Correlation Summary
| Measurement | Immigrants from Italy | Central American |
| Minimum | 7.9% | 18.1% |
| Maximum | 100.0% | 100.0% |
| Range | 92.1% | 81.9% |
| Mean | 38.5% | 41.3% |
| Median | 27.2% | 39.1% |
| Interquartile 25% (IQ1) | 22.8% | 35.0% |
| Interquartile 75% (IQ3) | 38.0% | 44.6% |
| Interquartile Range (IQR) | 15.2% | 9.5% |
| Standard Deviation (Sample) | 29.4% | 11.2% |
| Standard Deviation (Population) | 28.3% | 11.1% |
Similar Demographics by Births to Unmarried Women
Demographics Similar to Immigrants from Italy by Births to Unmarried Women
In terms of births to unmarried women, the demographic groups most similar to Immigrants from Italy are Ethiopian (29.8%, a difference of 0.080%), Immigrants from Netherlands (29.9%, a difference of 0.21%), Immigrants from Norway (29.9%, a difference of 0.23%), Immigrants from Croatia (29.8%, a difference of 0.30%), and Scandinavian (29.8%, a difference of 0.36%).
| Demographics | Rating | Rank | Births to Unmarried Women |
| Greeks | 93.4 /100 | #109 | Exceptional 29.7% |
| Immigrants | Ethiopia | 93.4 /100 | #110 | Exceptional 29.7% |
| Immigrants | Hungary | 93.0 /100 | #111 | Exceptional 29.7% |
| Basques | 93.0 /100 | #112 | Exceptional 29.7% |
| Scandinavians | 92.7 /100 | #113 | Exceptional 29.8% |
| Immigrants | Croatia | 92.6 /100 | #114 | Exceptional 29.8% |
| Ethiopians | 91.9 /100 | #115 | Exceptional 29.8% |
| Immigrants | Italy | 91.7 /100 | #116 | Exceptional 29.9% |
| Immigrants | Netherlands | 91.1 /100 | #117 | Exceptional 29.9% |
| Immigrants | Norway | 91.0 /100 | #118 | Exceptional 29.9% |
| Argentineans | 90.5 /100 | #119 | Exceptional 30.0% |
| Ugandans | 89.2 /100 | #120 | Excellent 30.1% |
| Koreans | 88.9 /100 | #121 | Excellent 30.1% |
| Immigrants | Argentina | 88.7 /100 | #122 | Excellent 30.1% |
| Syrians | 88.2 /100 | #123 | Excellent 30.2% |
Demographics Similar to Central Americans by Births to Unmarried Women
In terms of births to unmarried women, the demographic groups most similar to Central Americans are Comanche (36.7%, a difference of 0.010%), Immigrants from Senegal (36.7%, a difference of 0.070%), Cherokee (36.7%, a difference of 0.12%), Senegalese (36.8%, a difference of 0.13%), and Subsaharan African (36.7%, a difference of 0.17%).
| Demographics | Rating | Rank | Births to Unmarried Women |
| Ottawa | 0.2 /100 | #260 | Tragic 36.5% |
| Trinidadians and Tobagonians | 0.2 /100 | #261 | Tragic 36.5% |
| French American Indians | 0.1 /100 | #262 | Tragic 36.6% |
| Nicaraguans | 0.1 /100 | #263 | Tragic 36.6% |
| Sub-Saharan Africans | 0.1 /100 | #264 | Tragic 36.7% |
| Cherokee | 0.1 /100 | #265 | Tragic 36.7% |
| Immigrants | Senegal | 0.1 /100 | #266 | Tragic 36.7% |
| Central Americans | 0.1 /100 | #267 | Tragic 36.7% |
| Comanche | 0.1 /100 | #268 | Tragic 36.7% |
| Senegalese | 0.1 /100 | #269 | Tragic 36.8% |
| Immigrants | Congo | 0.1 /100 | #270 | Tragic 36.8% |
| Immigrants | Barbados | 0.1 /100 | #271 | Tragic 36.8% |
| Choctaw | 0.1 /100 | #272 | Tragic 36.9% |
| Mexicans | 0.1 /100 | #273 | Tragic 36.9% |
| Cree | 0.1 /100 | #274 | Tragic 37.0% |