Liberian vs Central American 3rd Grade
COMPARE
Liberian
Central American
3rd Grade
3rd Grade Comparison
Liberians
Central Americans
97.4%
3RD GRADE
1.8/ 100
METRIC RATING
236th/ 347
METRIC RANK
96.1%
3RD GRADE
0.0/ 100
METRIC RATING
337th/ 347
METRIC RANK
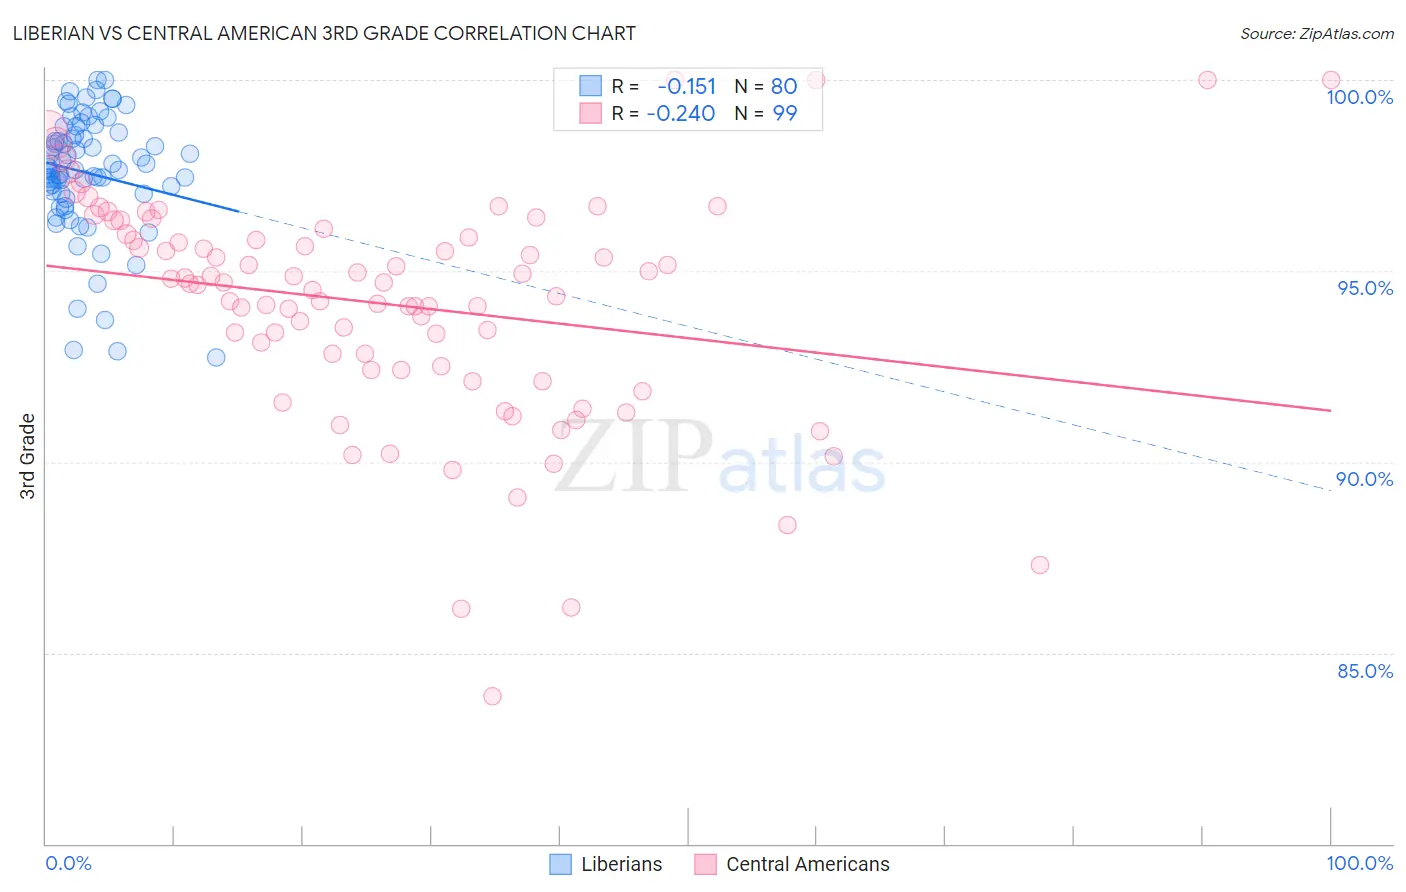
Liberian vs Central American 3rd Grade Correlation Chart
The statistical analysis conducted on geographies consisting of 118,103,458 people shows a poor negative correlation between the proportion of Liberians and percentage of population with at least 3rd grade education in the United States with a correlation coefficient (R) of -0.151 and weighted average of 97.4%. Similarly, the statistical analysis conducted on geographies consisting of 504,619,275 people shows a weak negative correlation between the proportion of Central Americans and percentage of population with at least 3rd grade education in the United States with a correlation coefficient (R) of -0.240 and weighted average of 96.1%, a difference of 1.4%.
3rd Grade Correlation Summary
| Measurement | Liberian | Central American |
| Minimum | 92.7% | 83.9% |
| Maximum | 100.0% | 100.0% |
| Range | 7.3% | 16.1% |
| Mean | 97.6% | 94.1% |
| Median | 97.7% | 94.7% |
| Interquartile 25% (IQ1) | 97.0% | 92.4% |
| Interquartile 75% (IQ3) | 98.6% | 96.0% |
| Interquartile Range (IQR) | 1.6% | 3.6% |
| Standard Deviation (Sample) | 1.6% | 3.0% |
| Standard Deviation (Population) | 1.6% | 3.0% |
Similar Demographics by 3rd Grade
Demographics Similar to Liberians by 3rd Grade
In terms of 3rd grade, the demographic groups most similar to Liberians are Immigrants from Iraq (97.4%, a difference of 0.0%), Colombian (97.4%, a difference of 0.0%), Immigrants from Eastern Asia (97.4%, a difference of 0.010%), Immigrants from Uruguay (97.4%, a difference of 0.010%), and Nigerian (97.4%, a difference of 0.010%).
| Demographics | Rating | Rank | 3rd Grade |
| Senegalese | 3.0 /100 | #229 | Tragic 97.5% |
| Immigrants | Pakistan | 2.7 /100 | #230 | Tragic 97.5% |
| Immigrants | Costa Rica | 2.7 /100 | #231 | Tragic 97.5% |
| Immigrants | Western Asia | 2.6 /100 | #232 | Tragic 97.5% |
| Immigrants | Malaysia | 2.4 /100 | #233 | Tragic 97.5% |
| Immigrants | Eastern Asia | 1.9 /100 | #234 | Tragic 97.4% |
| Immigrants | Iraq | 1.8 /100 | #235 | Tragic 97.4% |
| Liberians | 1.8 /100 | #236 | Tragic 97.4% |
| Colombians | 1.8 /100 | #237 | Tragic 97.4% |
| Immigrants | Uruguay | 1.7 /100 | #238 | Tragic 97.4% |
| Nigerians | 1.6 /100 | #239 | Tragic 97.4% |
| U.S. Virgin Islanders | 1.4 /100 | #240 | Tragic 97.4% |
| Immigrants | Indonesia | 1.4 /100 | #241 | Tragic 97.4% |
| Koreans | 1.3 /100 | #242 | Tragic 97.4% |
| Indians (Asian) | 1.3 /100 | #243 | Tragic 97.4% |
Demographics Similar to Central Americans by 3rd Grade
In terms of 3rd grade, the demographic groups most similar to Central Americans are Immigrants from Cabo Verde (96.2%, a difference of 0.080%), Immigrants from Cambodia (96.2%, a difference of 0.10%), Immigrants from Dominican Republic (96.2%, a difference of 0.10%), Immigrants from Fiji (96.2%, a difference of 0.12%), and Guatemalan (96.0%, a difference of 0.12%).
| Demographics | Rating | Rank | 3rd Grade |
| Immigrants | Armenia | 0.0 /100 | #330 | Tragic 96.3% |
| Immigrants | Latin America | 0.0 /100 | #331 | Tragic 96.2% |
| Mexicans | 0.0 /100 | #332 | Tragic 96.2% |
| Immigrants | Fiji | 0.0 /100 | #333 | Tragic 96.2% |
| Immigrants | Cambodia | 0.0 /100 | #334 | Tragic 96.2% |
| Immigrants | Dominican Republic | 0.0 /100 | #335 | Tragic 96.2% |
| Immigrants | Cabo Verde | 0.0 /100 | #336 | Tragic 96.2% |
| Central Americans | 0.0 /100 | #337 | Tragic 96.1% |
| Guatemalans | 0.0 /100 | #338 | Tragic 96.0% |
| Yakama | 0.0 /100 | #339 | Tragic 95.9% |
| Nepalese | 0.0 /100 | #340 | Tragic 95.9% |
| Immigrants | Central America | 0.0 /100 | #341 | Tragic 95.8% |
| Immigrants | Guatemala | 0.0 /100 | #342 | Tragic 95.8% |
| Immigrants | Mexico | 0.0 /100 | #343 | Tragic 95.8% |
| Salvadorans | 0.0 /100 | #344 | Tragic 95.7% |