Latvian vs Immigrants from Iran Family Households
COMPARE
Latvian
Immigrants from Iran
Family Households
Family Households Comparison
Latvians
Immigrants from Iran
62.8%
FAMILY HOUSEHOLDS
0.1/ 100
METRIC RATING
287th/ 347
METRIC RANK
64.1%
FAMILY HOUSEHOLDS
30.4/ 100
METRIC RATING
185th/ 347
METRIC RANK
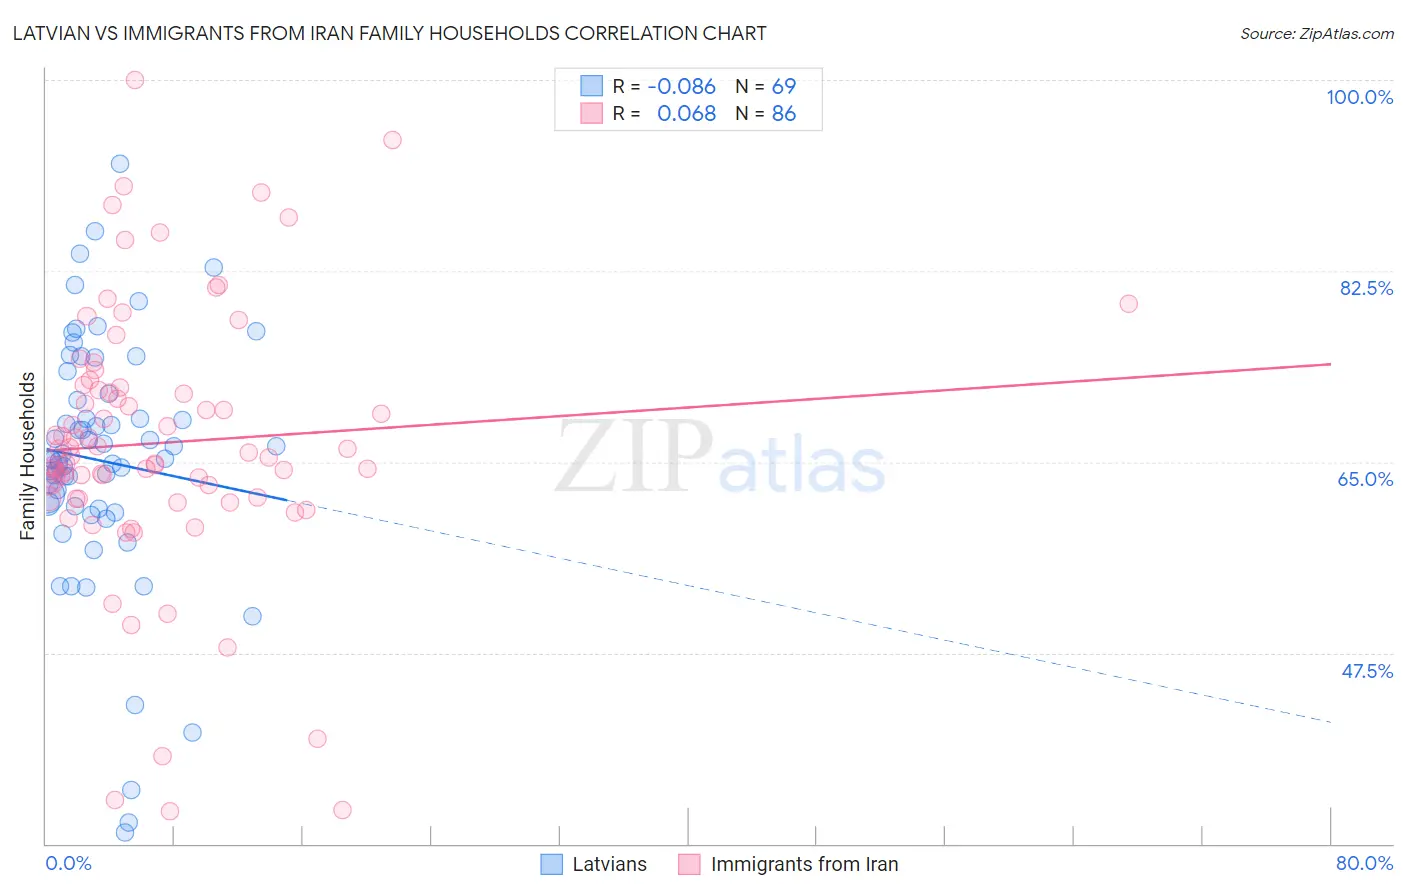
Latvian vs Immigrants from Iran Family Households Correlation Chart
The statistical analysis conducted on geographies consisting of 220,652,081 people shows a slight negative correlation between the proportion of Latvians and percentage of family households in the United States with a correlation coefficient (R) of -0.086 and weighted average of 62.8%. Similarly, the statistical analysis conducted on geographies consisting of 279,831,456 people shows a slight positive correlation between the proportion of Immigrants from Iran and percentage of family households in the United States with a correlation coefficient (R) of 0.068 and weighted average of 64.1%, a difference of 2.2%.
Family Households Correlation Summary
| Measurement | Latvian | Immigrants from Iran |
| Minimum | 31.0% | 33.0% |
| Maximum | 92.3% | 100.0% |
| Range | 61.3% | 67.0% |
| Mean | 65.1% | 66.7% |
| Median | 65.3% | 65.7% |
| Interquartile 25% (IQ1) | 60.8% | 61.7% |
| Interquartile 75% (IQ3) | 70.9% | 71.8% |
| Interquartile Range (IQR) | 10.1% | 10.2% |
| Standard Deviation (Sample) | 11.5% | 12.3% |
| Standard Deviation (Population) | 11.4% | 12.3% |
Similar Demographics by Family Households
Demographics Similar to Latvians by Family Households
In terms of family households, the demographic groups most similar to Latvians are British West Indian (62.8%, a difference of 0.0%), Immigrants from Uganda (62.7%, a difference of 0.020%), Mongolian (62.8%, a difference of 0.030%), Immigrants from Nepal (62.7%, a difference of 0.11%), and Australian (62.8%, a difference of 0.14%).
| Demographics | Rating | Rank | Family Households |
| Immigrants | Bulgaria | 0.2 /100 | #280 | Tragic 63.0% |
| Estonians | 0.2 /100 | #281 | Tragic 62.9% |
| New Zealanders | 0.1 /100 | #282 | Tragic 62.9% |
| Immigrants | Denmark | 0.1 /100 | #283 | Tragic 62.9% |
| Australians | 0.1 /100 | #284 | Tragic 62.8% |
| Mongolians | 0.1 /100 | #285 | Tragic 62.8% |
| British West Indians | 0.1 /100 | #286 | Tragic 62.8% |
| Latvians | 0.1 /100 | #287 | Tragic 62.8% |
| Immigrants | Uganda | 0.1 /100 | #288 | Tragic 62.7% |
| Immigrants | Nepal | 0.1 /100 | #289 | Tragic 62.7% |
| Immigrants | Grenada | 0.0 /100 | #290 | Tragic 62.6% |
| U.S. Virgin Islanders | 0.0 /100 | #291 | Tragic 62.6% |
| Immigrants | Burma/Myanmar | 0.0 /100 | #292 | Tragic 62.6% |
| Immigrants | Sweden | 0.0 /100 | #293 | Tragic 62.5% |
| Barbadians | 0.0 /100 | #294 | Tragic 62.5% |
Demographics Similar to Immigrants from Iran by Family Households
In terms of family households, the demographic groups most similar to Immigrants from Iran are Spanish American (64.1%, a difference of 0.010%), Northern European (64.1%, a difference of 0.040%), Puerto Rican (64.2%, a difference of 0.050%), Ukrainian (64.2%, a difference of 0.060%), and Creek (64.2%, a difference of 0.060%).
| Demographics | Rating | Rank | Family Households |
| Jamaicans | 40.6 /100 | #178 | Average 64.2% |
| Immigrants | Ukraine | 38.2 /100 | #179 | Fair 64.2% |
| Immigrants | Honduras | 35.0 /100 | #180 | Fair 64.2% |
| Immigrants | Trinidad and Tobago | 34.9 /100 | #181 | Fair 64.2% |
| Ukrainians | 34.6 /100 | #182 | Fair 64.2% |
| Creek | 34.1 /100 | #183 | Fair 64.2% |
| Puerto Ricans | 33.4 /100 | #184 | Fair 64.2% |
| Immigrants | Iran | 30.4 /100 | #185 | Fair 64.1% |
| Spanish Americans | 30.1 /100 | #186 | Fair 64.1% |
| Northern Europeans | 28.2 /100 | #187 | Fair 64.1% |
| Paraguayans | 26.7 /100 | #188 | Fair 64.1% |
| Immigrants | Western Asia | 25.3 /100 | #189 | Fair 64.1% |
| Zimbabweans | 24.7 /100 | #190 | Fair 64.1% |
| Arabs | 24.5 /100 | #191 | Fair 64.1% |
| Lithuanians | 23.8 /100 | #192 | Fair 64.0% |