Latvian vs Guyanese Family Households
COMPARE
Latvian
Guyanese
Family Households
Family Households Comparison
Latvians
Guyanese
62.8%
FAMILY HOUSEHOLDS
0.1/ 100
METRIC RATING
287th/ 347
METRIC RANK
65.3%
FAMILY HOUSEHOLDS
98.8/ 100
METRIC RATING
93rd/ 347
METRIC RANK
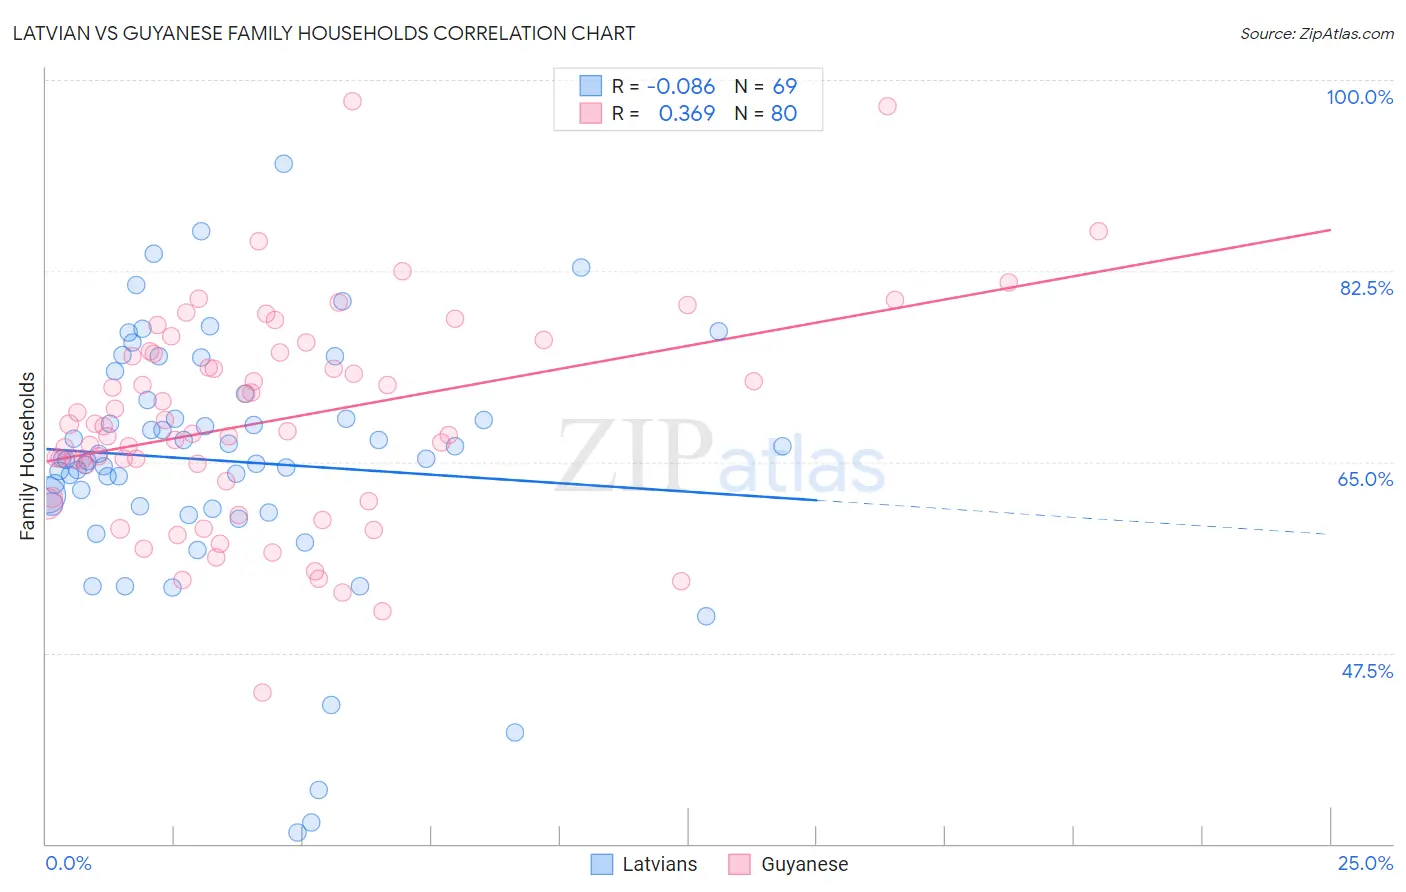
Latvian vs Guyanese Family Households Correlation Chart
The statistical analysis conducted on geographies consisting of 220,652,081 people shows a slight negative correlation between the proportion of Latvians and percentage of family households in the United States with a correlation coefficient (R) of -0.086 and weighted average of 62.8%. Similarly, the statistical analysis conducted on geographies consisting of 176,801,738 people shows a mild positive correlation between the proportion of Guyanese and percentage of family households in the United States with a correlation coefficient (R) of 0.369 and weighted average of 65.3%, a difference of 4.0%.
Family Households Correlation Summary
| Measurement | Latvian | Guyanese |
| Minimum | 31.0% | 43.8% |
| Maximum | 92.3% | 98.1% |
| Range | 61.3% | 54.2% |
| Mean | 65.1% | 68.8% |
| Median | 65.3% | 68.1% |
| Interquartile 25% (IQ1) | 60.8% | 62.5% |
| Interquartile 75% (IQ3) | 70.9% | 74.9% |
| Interquartile Range (IQR) | 10.1% | 12.4% |
| Standard Deviation (Sample) | 11.5% | 9.7% |
| Standard Deviation (Population) | 11.4% | 9.7% |
Similar Demographics by Family Households
Demographics Similar to Latvians by Family Households
In terms of family households, the demographic groups most similar to Latvians are British West Indian (62.8%, a difference of 0.0%), Immigrants from Uganda (62.7%, a difference of 0.020%), Mongolian (62.8%, a difference of 0.030%), Immigrants from Nepal (62.7%, a difference of 0.11%), and Australian (62.8%, a difference of 0.14%).
| Demographics | Rating | Rank | Family Households |
| Immigrants | Bulgaria | 0.2 /100 | #280 | Tragic 63.0% |
| Estonians | 0.2 /100 | #281 | Tragic 62.9% |
| New Zealanders | 0.1 /100 | #282 | Tragic 62.9% |
| Immigrants | Denmark | 0.1 /100 | #283 | Tragic 62.9% |
| Australians | 0.1 /100 | #284 | Tragic 62.8% |
| Mongolians | 0.1 /100 | #285 | Tragic 62.8% |
| British West Indians | 0.1 /100 | #286 | Tragic 62.8% |
| Latvians | 0.1 /100 | #287 | Tragic 62.8% |
| Immigrants | Uganda | 0.1 /100 | #288 | Tragic 62.7% |
| Immigrants | Nepal | 0.1 /100 | #289 | Tragic 62.7% |
| Immigrants | Grenada | 0.0 /100 | #290 | Tragic 62.6% |
| U.S. Virgin Islanders | 0.0 /100 | #291 | Tragic 62.6% |
| Immigrants | Burma/Myanmar | 0.0 /100 | #292 | Tragic 62.6% |
| Immigrants | Sweden | 0.0 /100 | #293 | Tragic 62.5% |
| Barbadians | 0.0 /100 | #294 | Tragic 62.5% |
Demographics Similar to Guyanese by Family Households
In terms of family households, the demographic groups most similar to Guyanese are Hopi (65.3%, a difference of 0.0%), Immigrants from Poland (65.2%, a difference of 0.020%), Immigrants from Portugal (65.2%, a difference of 0.040%), Crow (65.3%, a difference of 0.050%), and Swiss (65.2%, a difference of 0.050%).
| Demographics | Rating | Rank | Family Households |
| Egyptians | 99.4 /100 | #86 | Exceptional 65.4% |
| Immigrants | Egypt | 99.2 /100 | #87 | Exceptional 65.3% |
| Immigrants | Haiti | 99.1 /100 | #88 | Exceptional 65.3% |
| Immigrants | Caribbean | 99.1 /100 | #89 | Exceptional 65.3% |
| Immigrants | Laos | 99.1 /100 | #90 | Exceptional 65.3% |
| Crow | 98.9 /100 | #91 | Exceptional 65.3% |
| Hopi | 98.8 /100 | #92 | Exceptional 65.3% |
| Guyanese | 98.8 /100 | #93 | Exceptional 65.3% |
| Immigrants | Poland | 98.7 /100 | #94 | Exceptional 65.2% |
| Immigrants | Portugal | 98.6 /100 | #95 | Exceptional 65.2% |
| Swiss | 98.6 /100 | #96 | Exceptional 65.2% |
| Guatemalans | 98.6 /100 | #97 | Exceptional 65.2% |
| Immigrants | Syria | 98.4 /100 | #98 | Exceptional 65.2% |
| Central American Indians | 98.3 /100 | #99 | Exceptional 65.2% |
| Haitians | 98.1 /100 | #100 | Exceptional 65.2% |