Latvian vs Hispanic or Latino Family Households
COMPARE
Latvian
Hispanic or Latino
Family Households
Family Households Comparison
Latvians
Hispanics or Latinos
62.8%
FAMILY HOUSEHOLDS
0.1/ 100
METRIC RATING
287th/ 347
METRIC RANK
67.4%
FAMILY HOUSEHOLDS
100.0/ 100
METRIC RATING
27th/ 347
METRIC RANK
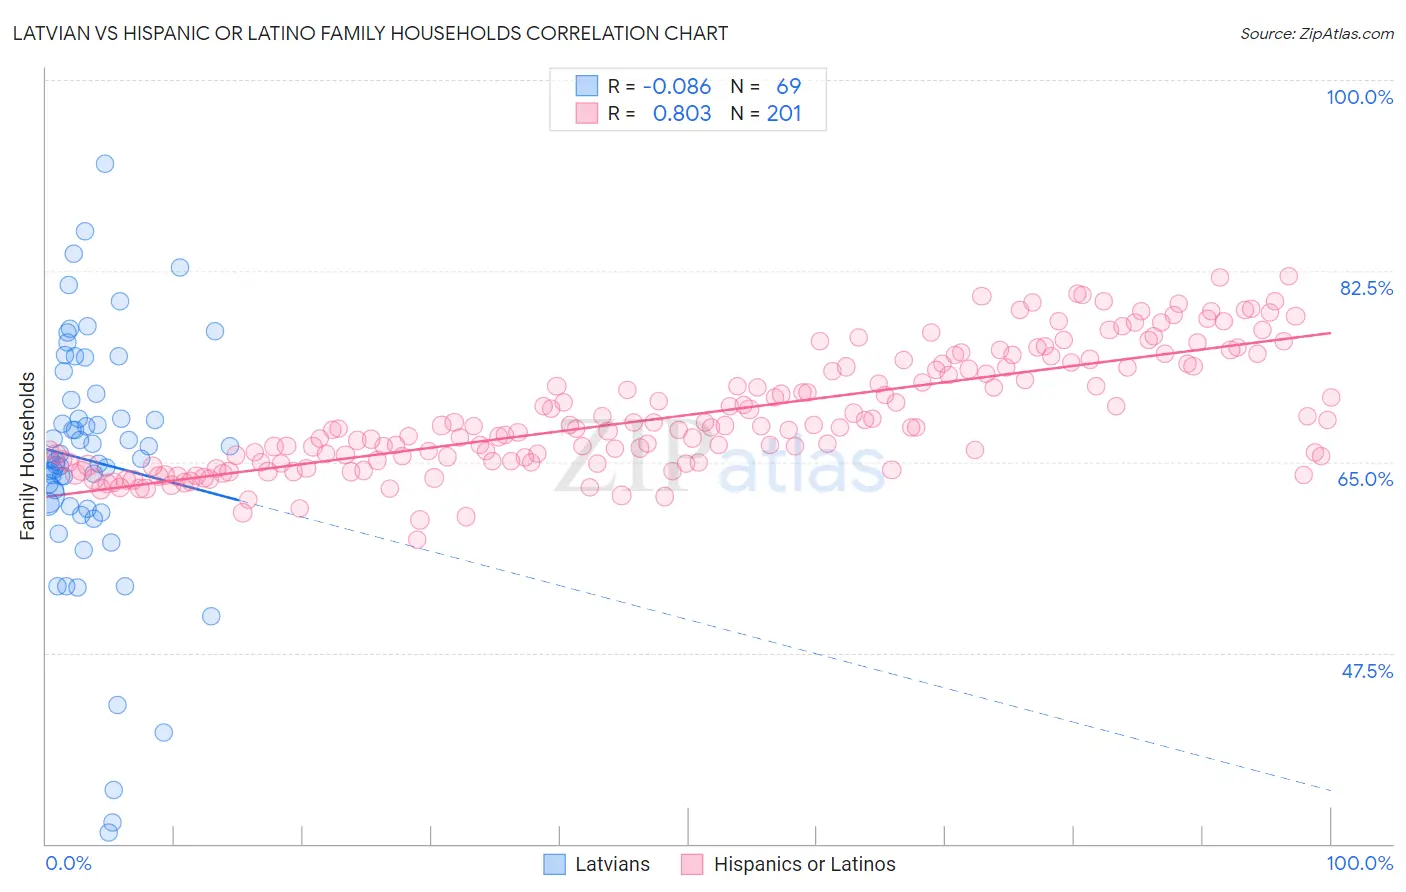
Latvian vs Hispanic or Latino Family Households Correlation Chart
The statistical analysis conducted on geographies consisting of 220,652,081 people shows a slight negative correlation between the proportion of Latvians and percentage of family households in the United States with a correlation coefficient (R) of -0.086 and weighted average of 62.8%. Similarly, the statistical analysis conducted on geographies consisting of 577,913,054 people shows a very strong positive correlation between the proportion of Hispanics or Latinos and percentage of family households in the United States with a correlation coefficient (R) of 0.803 and weighted average of 67.4%, a difference of 7.4%.
Family Households Correlation Summary
| Measurement | Latvian | Hispanic or Latino |
| Minimum | 31.0% | 57.8% |
| Maximum | 92.3% | 82.0% |
| Range | 61.3% | 24.1% |
| Mean | 65.1% | 69.3% |
| Median | 65.3% | 68.2% |
| Interquartile 25% (IQ1) | 60.8% | 65.0% |
| Interquartile 75% (IQ3) | 70.9% | 73.7% |
| Interquartile Range (IQR) | 10.1% | 8.7% |
| Standard Deviation (Sample) | 11.5% | 5.4% |
| Standard Deviation (Population) | 11.4% | 5.4% |
Similar Demographics by Family Households
Demographics Similar to Latvians by Family Households
In terms of family households, the demographic groups most similar to Latvians are British West Indian (62.8%, a difference of 0.0%), Immigrants from Uganda (62.7%, a difference of 0.020%), Mongolian (62.8%, a difference of 0.030%), Immigrants from Nepal (62.7%, a difference of 0.11%), and Australian (62.8%, a difference of 0.14%).
| Demographics | Rating | Rank | Family Households |
| Immigrants | Bulgaria | 0.2 /100 | #280 | Tragic 63.0% |
| Estonians | 0.2 /100 | #281 | Tragic 62.9% |
| New Zealanders | 0.1 /100 | #282 | Tragic 62.9% |
| Immigrants | Denmark | 0.1 /100 | #283 | Tragic 62.9% |
| Australians | 0.1 /100 | #284 | Tragic 62.8% |
| Mongolians | 0.1 /100 | #285 | Tragic 62.8% |
| British West Indians | 0.1 /100 | #286 | Tragic 62.8% |
| Latvians | 0.1 /100 | #287 | Tragic 62.8% |
| Immigrants | Uganda | 0.1 /100 | #288 | Tragic 62.7% |
| Immigrants | Nepal | 0.1 /100 | #289 | Tragic 62.7% |
| Immigrants | Grenada | 0.0 /100 | #290 | Tragic 62.6% |
| U.S. Virgin Islanders | 0.0 /100 | #291 | Tragic 62.6% |
| Immigrants | Burma/Myanmar | 0.0 /100 | #292 | Tragic 62.6% |
| Immigrants | Sweden | 0.0 /100 | #293 | Tragic 62.5% |
| Barbadians | 0.0 /100 | #294 | Tragic 62.5% |
Demographics Similar to Hispanics or Latinos by Family Households
In terms of family households, the demographic groups most similar to Hispanics or Latinos are Hawaiian (67.4%, a difference of 0.010%), Immigrants from India (67.4%, a difference of 0.040%), Immigrants from Nicaragua (67.5%, a difference of 0.050%), Immigrants from South Eastern Asia (67.5%, a difference of 0.080%), and Nicaraguan (67.4%, a difference of 0.080%).
| Demographics | Rating | Rank | Family Households |
| Inupiat | 100.0 /100 | #20 | Exceptional 67.8% |
| Cubans | 100.0 /100 | #21 | Exceptional 67.7% |
| Sri Lankans | 100.0 /100 | #22 | Exceptional 67.7% |
| Immigrants | Pakistan | 100.0 /100 | #23 | Exceptional 67.7% |
| Immigrants | South Eastern Asia | 100.0 /100 | #24 | Exceptional 67.5% |
| Immigrants | Nicaragua | 100.0 /100 | #25 | Exceptional 67.5% |
| Immigrants | India | 100.0 /100 | #26 | Exceptional 67.4% |
| Hispanics or Latinos | 100.0 /100 | #27 | Exceptional 67.4% |
| Hawaiians | 100.0 /100 | #28 | Exceptional 67.4% |
| Nicaraguans | 100.0 /100 | #29 | Exceptional 67.4% |
| Immigrants | Peru | 100.0 /100 | #30 | Exceptional 67.2% |
| Immigrants | Latin America | 100.0 /100 | #31 | Exceptional 67.2% |
| Nepalese | 100.0 /100 | #32 | Exceptional 67.2% |
| Salvadorans | 100.0 /100 | #33 | Exceptional 67.2% |
| Thais | 100.0 /100 | #34 | Exceptional 67.2% |