Laotian vs Immigrants from Jamaica Currently Married
COMPARE
Laotian
Immigrants from Jamaica
Currently Married
Currently Married Comparison
Laotians
Immigrants from Jamaica
47.4%
CURRENTLY MARRIED
86.6/ 100
METRIC RATING
124th/ 347
METRIC RANK
41.1%
CURRENTLY MARRIED
0.0/ 100
METRIC RATING
320th/ 347
METRIC RANK
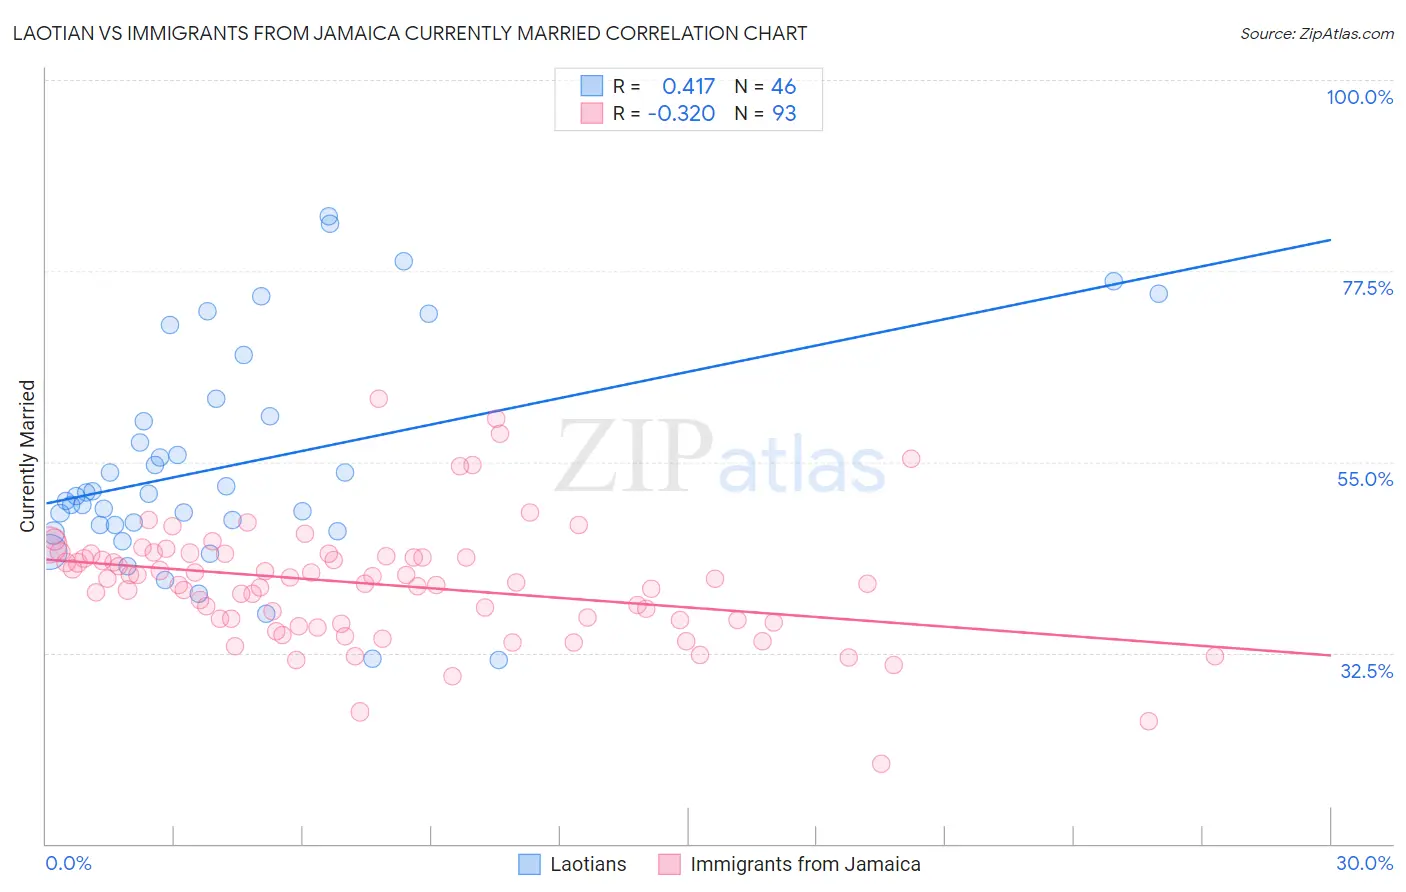
Laotian vs Immigrants from Jamaica Currently Married Correlation Chart
The statistical analysis conducted on geographies consisting of 224,816,761 people shows a moderate positive correlation between the proportion of Laotians and percentage of population currently married in the United States with a correlation coefficient (R) of 0.417 and weighted average of 47.4%. Similarly, the statistical analysis conducted on geographies consisting of 301,800,438 people shows a mild negative correlation between the proportion of Immigrants from Jamaica and percentage of population currently married in the United States with a correlation coefficient (R) of -0.320 and weighted average of 41.1%, a difference of 15.3%.
Currently Married Correlation Summary
| Measurement | Laotian | Immigrants from Jamaica |
| Minimum | 31.6% | 19.4% |
| Maximum | 83.9% | 62.4% |
| Range | 52.3% | 43.0% |
| Mean | 54.7% | 40.6% |
| Median | 51.1% | 40.8% |
| Interquartile 25% (IQ1) | 47.6% | 36.1% |
| Interquartile 75% (IQ3) | 60.4% | 44.0% |
| Interquartile Range (IQR) | 12.7% | 7.8% |
| Standard Deviation (Sample) | 12.9% | 7.0% |
| Standard Deviation (Population) | 12.8% | 7.0% |
Similar Demographics by Currently Married
Demographics Similar to Laotians by Currently Married
In terms of currently married, the demographic groups most similar to Laotians are Immigrants from Kazakhstan (47.4%, a difference of 0.050%), Okinawan (47.4%, a difference of 0.10%), Osage (47.5%, a difference of 0.11%), Immigrants from Jordan (47.4%, a difference of 0.13%), and New Zealander (47.4%, a difference of 0.13%).
| Demographics | Rating | Rank | Currently Married |
| Puget Sound Salish | 90.3 /100 | #117 | Exceptional 47.6% |
| Immigrants | Philippines | 90.2 /100 | #118 | Exceptional 47.6% |
| Australians | 90.2 /100 | #119 | Exceptional 47.6% |
| Syrians | 88.9 /100 | #120 | Excellent 47.5% |
| Immigrants | Croatia | 88.6 /100 | #121 | Excellent 47.5% |
| Osage | 87.9 /100 | #122 | Excellent 47.5% |
| Immigrants | Kazakhstan | 87.2 /100 | #123 | Excellent 47.4% |
| Laotians | 86.6 /100 | #124 | Excellent 47.4% |
| Okinawans | 85.3 /100 | #125 | Excellent 47.4% |
| Immigrants | Jordan | 84.9 /100 | #126 | Excellent 47.4% |
| New Zealanders | 84.9 /100 | #127 | Excellent 47.4% |
| Portuguese | 84.2 /100 | #128 | Excellent 47.3% |
| Sri Lankans | 83.2 /100 | #129 | Excellent 47.3% |
| Immigrants | Iraq | 82.8 /100 | #130 | Excellent 47.3% |
| Icelanders | 82.4 /100 | #131 | Excellent 47.3% |
Demographics Similar to Immigrants from Jamaica by Currently Married
In terms of currently married, the demographic groups most similar to Immigrants from Jamaica are Immigrants from Somalia (41.2%, a difference of 0.060%), Bahamian (41.2%, a difference of 0.080%), Immigrants from Congo (41.1%, a difference of 0.23%), Haitian (41.3%, a difference of 0.26%), and Immigrants from Caribbean (41.3%, a difference of 0.28%).
| Demographics | Rating | Rank | Currently Married |
| Jamaicans | 0.0 /100 | #313 | Tragic 41.4% |
| West Indians | 0.0 /100 | #314 | Tragic 41.3% |
| Inupiat | 0.0 /100 | #315 | Tragic 41.3% |
| Immigrants | Caribbean | 0.0 /100 | #316 | Tragic 41.3% |
| Haitians | 0.0 /100 | #317 | Tragic 41.3% |
| Bahamians | 0.0 /100 | #318 | Tragic 41.2% |
| Immigrants | Somalia | 0.0 /100 | #319 | Tragic 41.2% |
| Immigrants | Jamaica | 0.0 /100 | #320 | Tragic 41.1% |
| Immigrants | Congo | 0.0 /100 | #321 | Tragic 41.1% |
| Immigrants | Haiti | 0.0 /100 | #322 | Tragic 41.0% |
| Immigrants | West Indies | 0.0 /100 | #323 | Tragic 40.7% |
| Immigrants | Senegal | 0.0 /100 | #324 | Tragic 40.7% |
| U.S. Virgin Islanders | 0.0 /100 | #325 | Tragic 40.7% |
| Barbadians | 0.0 /100 | #326 | Tragic 40.6% |
| Senegalese | 0.0 /100 | #327 | Tragic 40.6% |