Laotian vs Hmong Currently Married
COMPARE
Laotian
Hmong
Currently Married
Currently Married Comparison
Laotians
Hmong
47.4%
CURRENTLY MARRIED
86.6/ 100
METRIC RATING
124th/ 347
METRIC RANK
47.1%
CURRENTLY MARRIED
73.4/ 100
METRIC RATING
144th/ 347
METRIC RANK
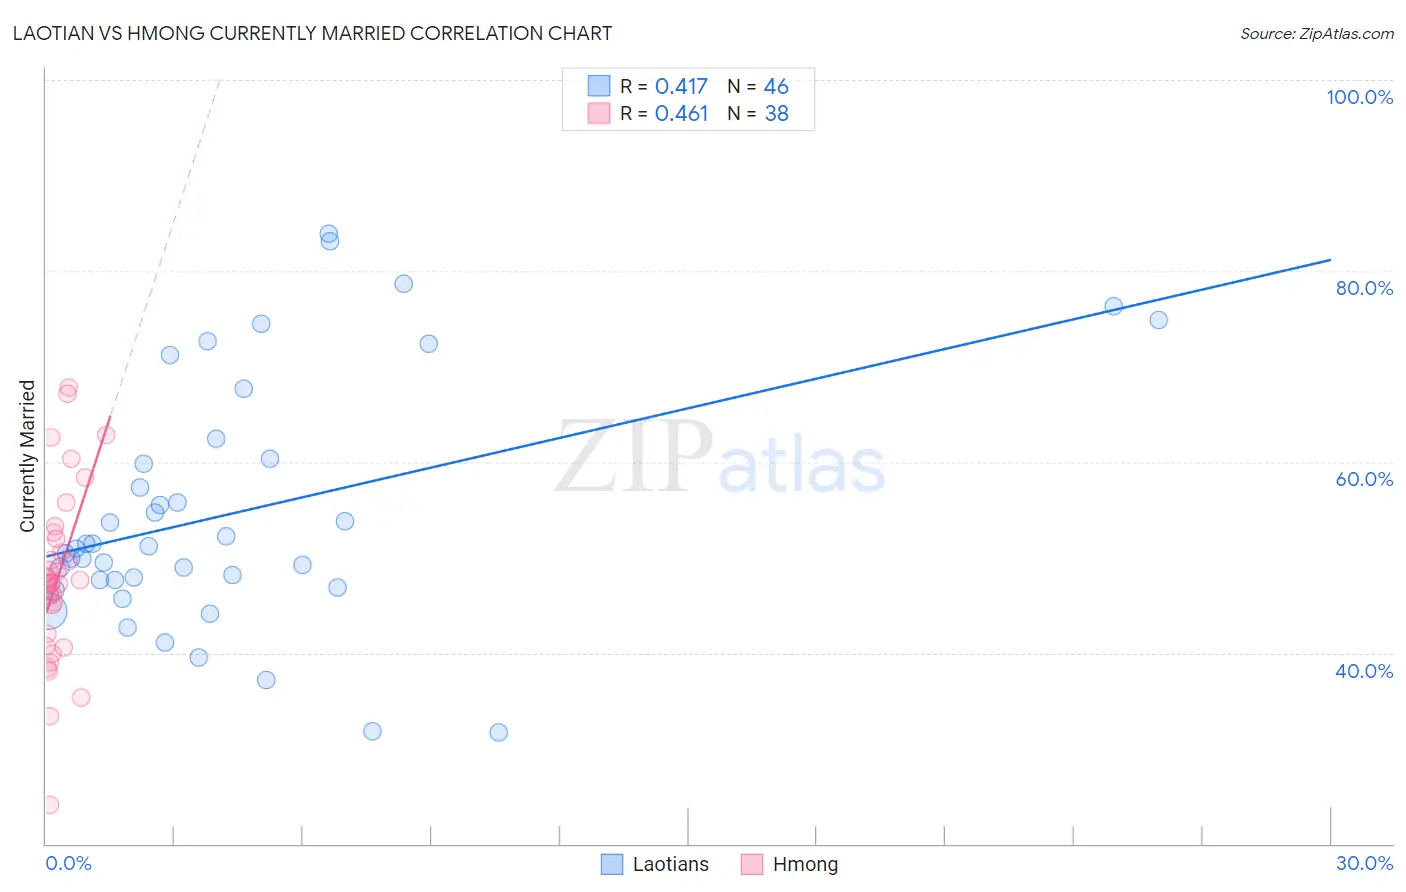
Laotian vs Hmong Currently Married Correlation Chart
The statistical analysis conducted on geographies consisting of 224,816,761 people shows a moderate positive correlation between the proportion of Laotians and percentage of population currently married in the United States with a correlation coefficient (R) of 0.417 and weighted average of 47.4%. Similarly, the statistical analysis conducted on geographies consisting of 24,669,739 people shows a moderate positive correlation between the proportion of Hmong and percentage of population currently married in the United States with a correlation coefficient (R) of 0.461 and weighted average of 47.1%, a difference of 0.77%.
Currently Married Correlation Summary
| Measurement | Laotian | Hmong |
| Minimum | 31.6% | 24.0% |
| Maximum | 83.9% | 67.8% |
| Range | 52.3% | 43.8% |
| Mean | 54.7% | 47.9% |
| Median | 51.1% | 47.4% |
| Interquartile 25% (IQ1) | 47.6% | 42.0% |
| Interquartile 75% (IQ3) | 60.4% | 52.0% |
| Interquartile Range (IQR) | 12.7% | 10.0% |
| Standard Deviation (Sample) | 12.9% | 9.1% |
| Standard Deviation (Population) | 12.8% | 9.0% |
Demographics Similar to Laotians and Hmong by Currently Married
In terms of currently married, the demographic groups most similar to Laotians are Okinawan (47.4%, a difference of 0.10%), Immigrants from Jordan (47.4%, a difference of 0.13%), New Zealander (47.4%, a difference of 0.13%), Portuguese (47.3%, a difference of 0.17%), and Sri Lankan (47.3%, a difference of 0.24%). Similarly, the demographic groups most similar to Hmong are Argentinean (47.1%, a difference of 0.040%), Guamanian/Chamorro (47.1%, a difference of 0.040%), Venezuelan (47.1%, a difference of 0.050%), Cajun (47.1%, a difference of 0.090%), and Yugoslavian (47.2%, a difference of 0.19%).
| Demographics | Rating | Rank | Currently Married |
| Laotians | 86.6 /100 | #124 | Excellent 47.4% |
| Okinawans | 85.3 /100 | #125 | Excellent 47.4% |
| Immigrants | Jordan | 84.9 /100 | #126 | Excellent 47.4% |
| New Zealanders | 84.9 /100 | #127 | Excellent 47.4% |
| Portuguese | 84.2 /100 | #128 | Excellent 47.3% |
| Sri Lankans | 83.2 /100 | #129 | Excellent 47.3% |
| Immigrants | Iraq | 82.8 /100 | #130 | Excellent 47.3% |
| Icelanders | 82.4 /100 | #131 | Excellent 47.3% |
| Afghans | 81.8 /100 | #132 | Excellent 47.3% |
| Immigrants | Malaysia | 81.1 /100 | #133 | Excellent 47.3% |
| Immigrants | Australia | 81.1 /100 | #134 | Excellent 47.3% |
| Immigrants | Norway | 79.7 /100 | #135 | Good 47.2% |
| Immigrants | Vietnam | 78.2 /100 | #136 | Good 47.2% |
| Paraguayans | 77.8 /100 | #137 | Good 47.2% |
| Pakistanis | 77.5 /100 | #138 | Good 47.2% |
| Yugoslavians | 77.4 /100 | #139 | Good 47.2% |
| Cajuns | 75.3 /100 | #140 | Good 47.1% |
| Venezuelans | 74.4 /100 | #141 | Good 47.1% |
| Argentineans | 74.4 /100 | #142 | Good 47.1% |
| Guamanians/Chamorros | 74.2 /100 | #143 | Good 47.1% |
| Hmong | 73.4 /100 | #144 | Good 47.1% |