Laotian vs Immigrants from St. Vincent and the Grenadines Currently Married
COMPARE
Laotian
Immigrants from St. Vincent and the Grenadines
Currently Married
Currently Married Comparison
Laotians
Immigrants from St. Vincent and the Grenadines
47.4%
CURRENTLY MARRIED
86.6/ 100
METRIC RATING
124th/ 347
METRIC RANK
40.1%
CURRENTLY MARRIED
0.0/ 100
METRIC RATING
332nd/ 347
METRIC RANK
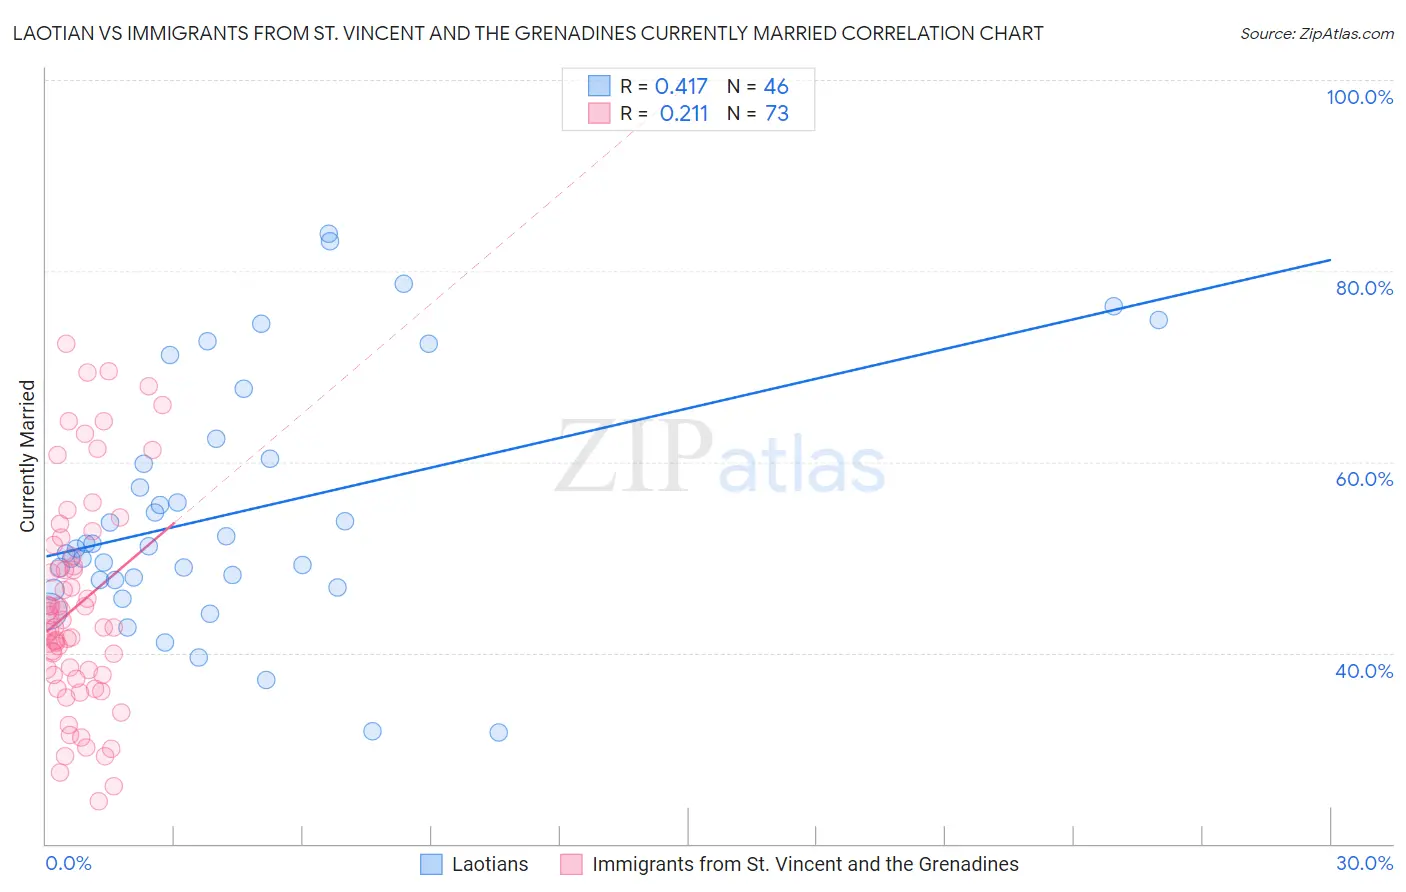
Laotian vs Immigrants from St. Vincent and the Grenadines Currently Married Correlation Chart
The statistical analysis conducted on geographies consisting of 224,816,761 people shows a moderate positive correlation between the proportion of Laotians and percentage of population currently married in the United States with a correlation coefficient (R) of 0.417 and weighted average of 47.4%. Similarly, the statistical analysis conducted on geographies consisting of 56,191,418 people shows a weak positive correlation between the proportion of Immigrants from St. Vincent and the Grenadines and percentage of population currently married in the United States with a correlation coefficient (R) of 0.211 and weighted average of 40.1%, a difference of 18.4%.
Currently Married Correlation Summary
| Measurement | Laotian | Immigrants from St. Vincent and the Grenadines |
| Minimum | 31.6% | 24.4% |
| Maximum | 83.9% | 72.4% |
| Range | 52.3% | 48.0% |
| Mean | 54.7% | 44.9% |
| Median | 51.1% | 42.7% |
| Interquartile 25% (IQ1) | 47.6% | 37.7% |
| Interquartile 75% (IQ3) | 60.4% | 50.7% |
| Interquartile Range (IQR) | 12.7% | 13.0% |
| Standard Deviation (Sample) | 12.9% | 11.2% |
| Standard Deviation (Population) | 12.8% | 11.1% |
Similar Demographics by Currently Married
Demographics Similar to Laotians by Currently Married
In terms of currently married, the demographic groups most similar to Laotians are Immigrants from Kazakhstan (47.4%, a difference of 0.050%), Okinawan (47.4%, a difference of 0.10%), Osage (47.5%, a difference of 0.11%), Immigrants from Jordan (47.4%, a difference of 0.13%), and New Zealander (47.4%, a difference of 0.13%).
| Demographics | Rating | Rank | Currently Married |
| Puget Sound Salish | 90.3 /100 | #117 | Exceptional 47.6% |
| Immigrants | Philippines | 90.2 /100 | #118 | Exceptional 47.6% |
| Australians | 90.2 /100 | #119 | Exceptional 47.6% |
| Syrians | 88.9 /100 | #120 | Excellent 47.5% |
| Immigrants | Croatia | 88.6 /100 | #121 | Excellent 47.5% |
| Osage | 87.9 /100 | #122 | Excellent 47.5% |
| Immigrants | Kazakhstan | 87.2 /100 | #123 | Excellent 47.4% |
| Laotians | 86.6 /100 | #124 | Excellent 47.4% |
| Okinawans | 85.3 /100 | #125 | Excellent 47.4% |
| Immigrants | Jordan | 84.9 /100 | #126 | Excellent 47.4% |
| New Zealanders | 84.9 /100 | #127 | Excellent 47.4% |
| Portuguese | 84.2 /100 | #128 | Excellent 47.3% |
| Sri Lankans | 83.2 /100 | #129 | Excellent 47.3% |
| Immigrants | Iraq | 82.8 /100 | #130 | Excellent 47.3% |
| Icelanders | 82.4 /100 | #131 | Excellent 47.3% |
Demographics Similar to Immigrants from St. Vincent and the Grenadines by Currently Married
In terms of currently married, the demographic groups most similar to Immigrants from St. Vincent and the Grenadines are Yup'ik (39.9%, a difference of 0.39%), Puerto Rican (39.9%, a difference of 0.41%), Lumbee (39.8%, a difference of 0.57%), Immigrants from Barbados (40.3%, a difference of 0.67%), and Immigrants from Dominica (40.3%, a difference of 0.69%).
| Demographics | Rating | Rank | Currently Married |
| U.S. Virgin Islanders | 0.0 /100 | #325 | Tragic 40.7% |
| Barbadians | 0.0 /100 | #326 | Tragic 40.6% |
| Senegalese | 0.0 /100 | #327 | Tragic 40.6% |
| Arapaho | 0.0 /100 | #328 | Tragic 40.5% |
| Crow | 0.0 /100 | #329 | Tragic 40.4% |
| Immigrants | Dominica | 0.0 /100 | #330 | Tragic 40.3% |
| Immigrants | Barbados | 0.0 /100 | #331 | Tragic 40.3% |
| Immigrants | St. Vincent and the Grenadines | 0.0 /100 | #332 | Tragic 40.1% |
| Yup'ik | 0.0 /100 | #333 | Tragic 39.9% |
| Puerto Ricans | 0.0 /100 | #334 | Tragic 39.9% |
| Lumbee | 0.0 /100 | #335 | Tragic 39.8% |
| British West Indians | 0.0 /100 | #336 | Tragic 39.8% |
| Blacks/African Americans | 0.0 /100 | #337 | Tragic 39.6% |
| Cape Verdeans | 0.0 /100 | #338 | Tragic 39.6% |
| Dominicans | 0.0 /100 | #339 | Tragic 39.5% |