Immigrants from Congo vs Immigrants from Jamaica Currently Married
COMPARE
Immigrants from Congo
Immigrants from Jamaica
Currently Married
Currently Married Comparison
Immigrants from Congo
Immigrants from Jamaica
41.1%
CURRENTLY MARRIED
0.0/ 100
METRIC RATING
321st/ 347
METRIC RANK
41.1%
CURRENTLY MARRIED
0.0/ 100
METRIC RATING
320th/ 347
METRIC RANK
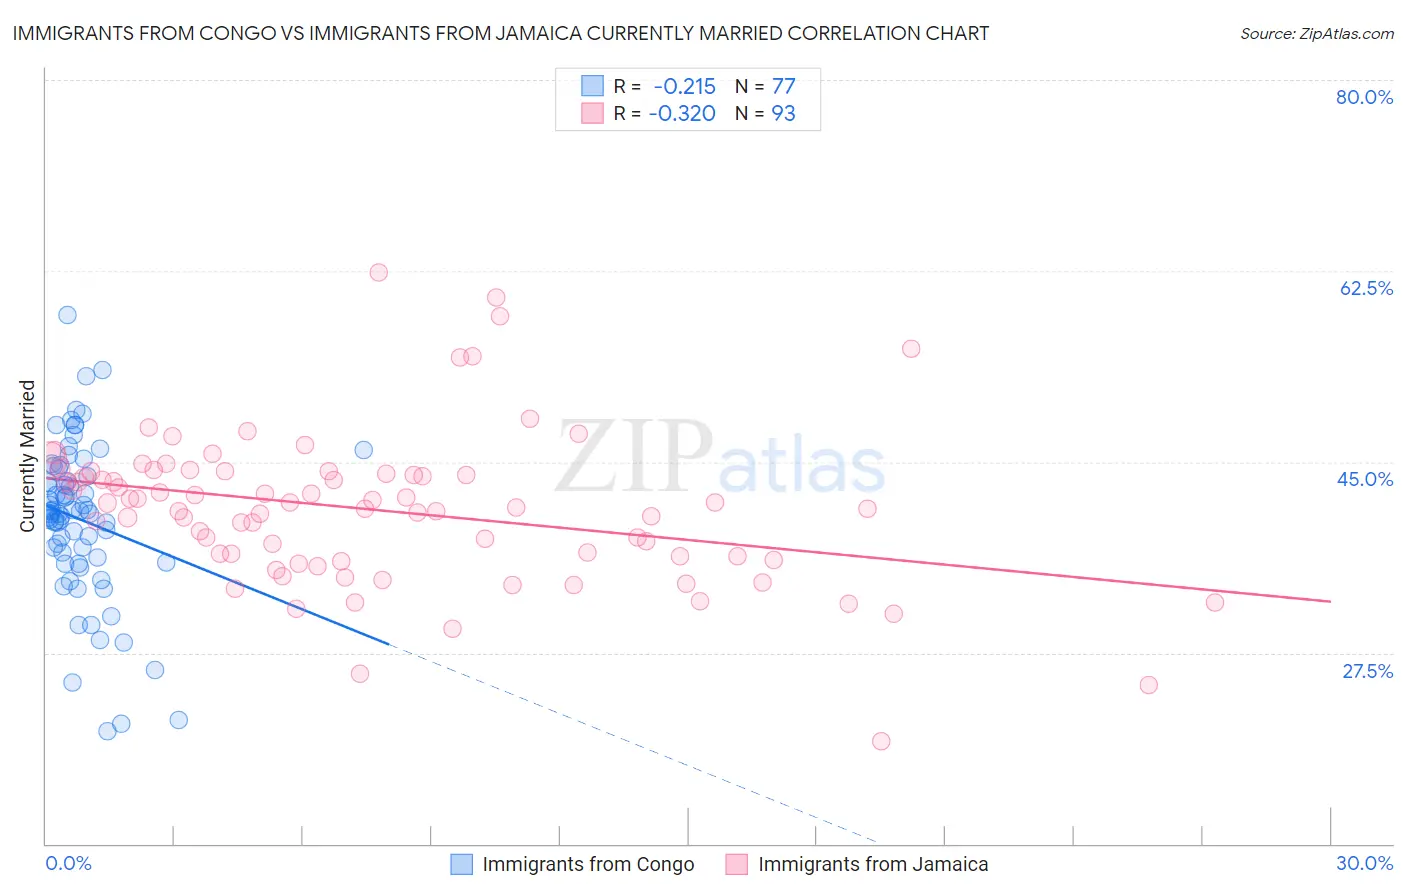
Immigrants from Congo vs Immigrants from Jamaica Currently Married Correlation Chart
The statistical analysis conducted on geographies consisting of 92,127,634 people shows a weak negative correlation between the proportion of Immigrants from Congo and percentage of population currently married in the United States with a correlation coefficient (R) of -0.215 and weighted average of 41.1%. Similarly, the statistical analysis conducted on geographies consisting of 301,800,438 people shows a mild negative correlation between the proportion of Immigrants from Jamaica and percentage of population currently married in the United States with a correlation coefficient (R) of -0.320 and weighted average of 41.1%, a difference of 0.23%.
Currently Married Correlation Summary
| Measurement | Immigrants from Congo | Immigrants from Jamaica |
| Minimum | 20.3% | 19.4% |
| Maximum | 58.5% | 62.4% |
| Range | 38.2% | 43.0% |
| Mean | 39.7% | 40.6% |
| Median | 40.3% | 40.8% |
| Interquartile 25% (IQ1) | 36.0% | 36.1% |
| Interquartile 75% (IQ3) | 44.0% | 44.0% |
| Interquartile Range (IQR) | 8.0% | 7.8% |
| Standard Deviation (Sample) | 7.2% | 7.0% |
| Standard Deviation (Population) | 7.2% | 7.0% |
Demographics Similar to Immigrants from Congo and Immigrants from Jamaica by Currently Married
In terms of currently married, the demographic groups most similar to Immigrants from Congo are Immigrants from Haiti (41.0%, a difference of 0.13%), Immigrants from Somalia (41.2%, a difference of 0.29%), Bahamian (41.2%, a difference of 0.31%), Haitian (41.3%, a difference of 0.49%), and Immigrants from Caribbean (41.3%, a difference of 0.51%). Similarly, the demographic groups most similar to Immigrants from Jamaica are Immigrants from Somalia (41.2%, a difference of 0.060%), Bahamian (41.2%, a difference of 0.080%), Haitian (41.3%, a difference of 0.26%), Immigrants from Caribbean (41.3%, a difference of 0.28%), and Inupiat (41.3%, a difference of 0.34%).
| Demographics | Rating | Rank | Currently Married |
| Guyanese | 0.0 /100 | #310 | Tragic 41.6% |
| Trinidadians and Tobagonians | 0.0 /100 | #311 | Tragic 41.5% |
| Somalis | 0.0 /100 | #312 | Tragic 41.5% |
| Jamaicans | 0.0 /100 | #313 | Tragic 41.4% |
| West Indians | 0.0 /100 | #314 | Tragic 41.3% |
| Inupiat | 0.0 /100 | #315 | Tragic 41.3% |
| Immigrants | Caribbean | 0.0 /100 | #316 | Tragic 41.3% |
| Haitians | 0.0 /100 | #317 | Tragic 41.3% |
| Bahamians | 0.0 /100 | #318 | Tragic 41.2% |
| Immigrants | Somalia | 0.0 /100 | #319 | Tragic 41.2% |
| Immigrants | Jamaica | 0.0 /100 | #320 | Tragic 41.1% |
| Immigrants | Congo | 0.0 /100 | #321 | Tragic 41.1% |
| Immigrants | Haiti | 0.0 /100 | #322 | Tragic 41.0% |
| Immigrants | West Indies | 0.0 /100 | #323 | Tragic 40.7% |
| Immigrants | Senegal | 0.0 /100 | #324 | Tragic 40.7% |
| U.S. Virgin Islanders | 0.0 /100 | #325 | Tragic 40.7% |
| Barbadians | 0.0 /100 | #326 | Tragic 40.6% |
| Senegalese | 0.0 /100 | #327 | Tragic 40.6% |
| Arapaho | 0.0 /100 | #328 | Tragic 40.5% |
| Crow | 0.0 /100 | #329 | Tragic 40.4% |
| Immigrants | Dominica | 0.0 /100 | #330 | Tragic 40.3% |