Indian (Asian) vs Immigrants from Jamaica Currently Married
COMPARE
Indian (Asian)
Immigrants from Jamaica
Currently Married
Currently Married Comparison
Indians (Asian)
Immigrants from Jamaica
48.0%
CURRENTLY MARRIED
95.8/ 100
METRIC RATING
89th/ 347
METRIC RANK
41.1%
CURRENTLY MARRIED
0.0/ 100
METRIC RATING
320th/ 347
METRIC RANK
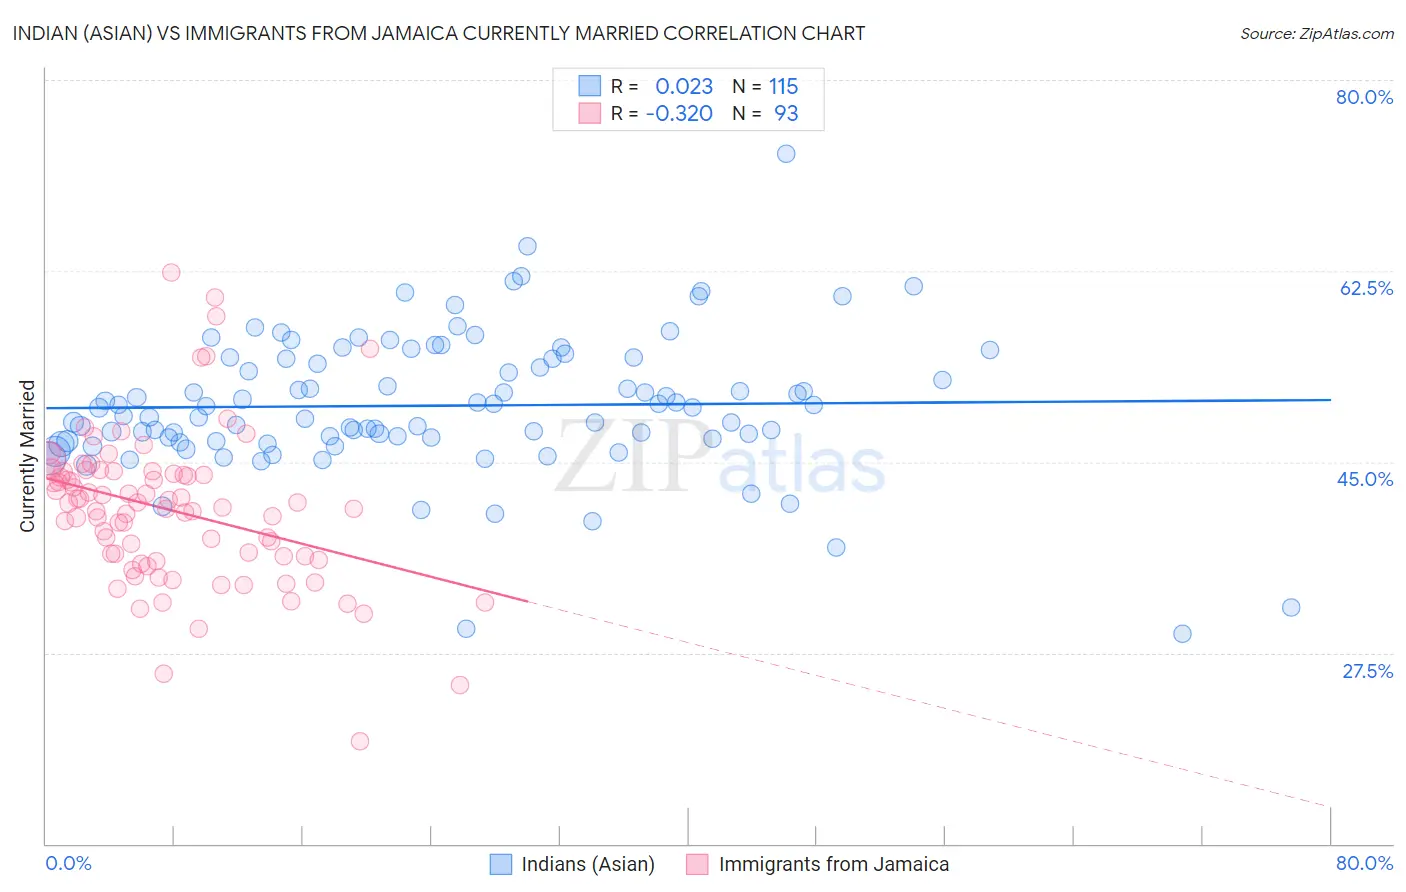
Indian (Asian) vs Immigrants from Jamaica Currently Married Correlation Chart
The statistical analysis conducted on geographies consisting of 495,221,745 people shows no correlation between the proportion of Indians (Asian) and percentage of population currently married in the United States with a correlation coefficient (R) of 0.023 and weighted average of 48.0%. Similarly, the statistical analysis conducted on geographies consisting of 301,800,438 people shows a mild negative correlation between the proportion of Immigrants from Jamaica and percentage of population currently married in the United States with a correlation coefficient (R) of -0.320 and weighted average of 41.1%, a difference of 16.6%.
Currently Married Correlation Summary
| Measurement | Indian (Asian) | Immigrants from Jamaica |
| Minimum | 29.3% | 19.4% |
| Maximum | 73.2% | 62.4% |
| Range | 43.9% | 43.0% |
| Mean | 50.1% | 40.6% |
| Median | 50.0% | 40.8% |
| Interquartile 25% (IQ1) | 46.9% | 36.1% |
| Interquartile 75% (IQ3) | 54.5% | 44.0% |
| Interquartile Range (IQR) | 7.5% | 7.8% |
| Standard Deviation (Sample) | 6.5% | 7.0% |
| Standard Deviation (Population) | 6.4% | 7.0% |
Similar Demographics by Currently Married
Demographics Similar to Indians (Asian) by Currently Married
In terms of currently married, the demographic groups most similar to Indians (Asian) are American (48.0%, a difference of 0.020%), Immigrants from Bolivia (47.9%, a difference of 0.050%), Immigrants from Eastern Europe (48.0%, a difference of 0.060%), Jordanian (48.0%, a difference of 0.080%), and Immigrants from Japan (48.0%, a difference of 0.090%).
| Demographics | Rating | Rank | Currently Married |
| Immigrants | Europe | 96.9 /100 | #82 | Exceptional 48.1% |
| Bolivians | 96.9 /100 | #83 | Exceptional 48.1% |
| Immigrants | Israel | 96.9 /100 | #84 | Exceptional 48.1% |
| French Canadians | 96.3 /100 | #85 | Exceptional 48.0% |
| Immigrants | Japan | 96.2 /100 | #86 | Exceptional 48.0% |
| Jordanians | 96.2 /100 | #87 | Exceptional 48.0% |
| Immigrants | Eastern Europe | 96.1 /100 | #88 | Exceptional 48.0% |
| Indians (Asian) | 95.8 /100 | #89 | Exceptional 48.0% |
| Americans | 95.7 /100 | #90 | Exceptional 48.0% |
| Immigrants | Bolivia | 95.6 /100 | #91 | Exceptional 47.9% |
| Koreans | 95.4 /100 | #92 | Exceptional 47.9% |
| Lebanese | 95.1 /100 | #93 | Exceptional 47.9% |
| Native Hawaiians | 95.0 /100 | #94 | Exceptional 47.9% |
| Immigrants | Bulgaria | 94.8 /100 | #95 | Exceptional 47.9% |
| Egyptians | 94.8 /100 | #96 | Exceptional 47.9% |
Demographics Similar to Immigrants from Jamaica by Currently Married
In terms of currently married, the demographic groups most similar to Immigrants from Jamaica are Immigrants from Somalia (41.2%, a difference of 0.060%), Bahamian (41.2%, a difference of 0.080%), Immigrants from Congo (41.1%, a difference of 0.23%), Haitian (41.3%, a difference of 0.26%), and Immigrants from Caribbean (41.3%, a difference of 0.28%).
| Demographics | Rating | Rank | Currently Married |
| Jamaicans | 0.0 /100 | #313 | Tragic 41.4% |
| West Indians | 0.0 /100 | #314 | Tragic 41.3% |
| Inupiat | 0.0 /100 | #315 | Tragic 41.3% |
| Immigrants | Caribbean | 0.0 /100 | #316 | Tragic 41.3% |
| Haitians | 0.0 /100 | #317 | Tragic 41.3% |
| Bahamians | 0.0 /100 | #318 | Tragic 41.2% |
| Immigrants | Somalia | 0.0 /100 | #319 | Tragic 41.2% |
| Immigrants | Jamaica | 0.0 /100 | #320 | Tragic 41.1% |
| Immigrants | Congo | 0.0 /100 | #321 | Tragic 41.1% |
| Immigrants | Haiti | 0.0 /100 | #322 | Tragic 41.0% |
| Immigrants | West Indies | 0.0 /100 | #323 | Tragic 40.7% |
| Immigrants | Senegal | 0.0 /100 | #324 | Tragic 40.7% |
| U.S. Virgin Islanders | 0.0 /100 | #325 | Tragic 40.7% |
| Barbadians | 0.0 /100 | #326 | Tragic 40.6% |
| Senegalese | 0.0 /100 | #327 | Tragic 40.6% |