Laotian vs Estonian Currently Married
COMPARE
Laotian
Estonian
Currently Married
Currently Married Comparison
Laotians
Estonians
47.4%
CURRENTLY MARRIED
86.6/ 100
METRIC RATING
124th/ 347
METRIC RANK
48.2%
CURRENTLY MARRIED
97.4/ 100
METRIC RATING
74th/ 347
METRIC RANK
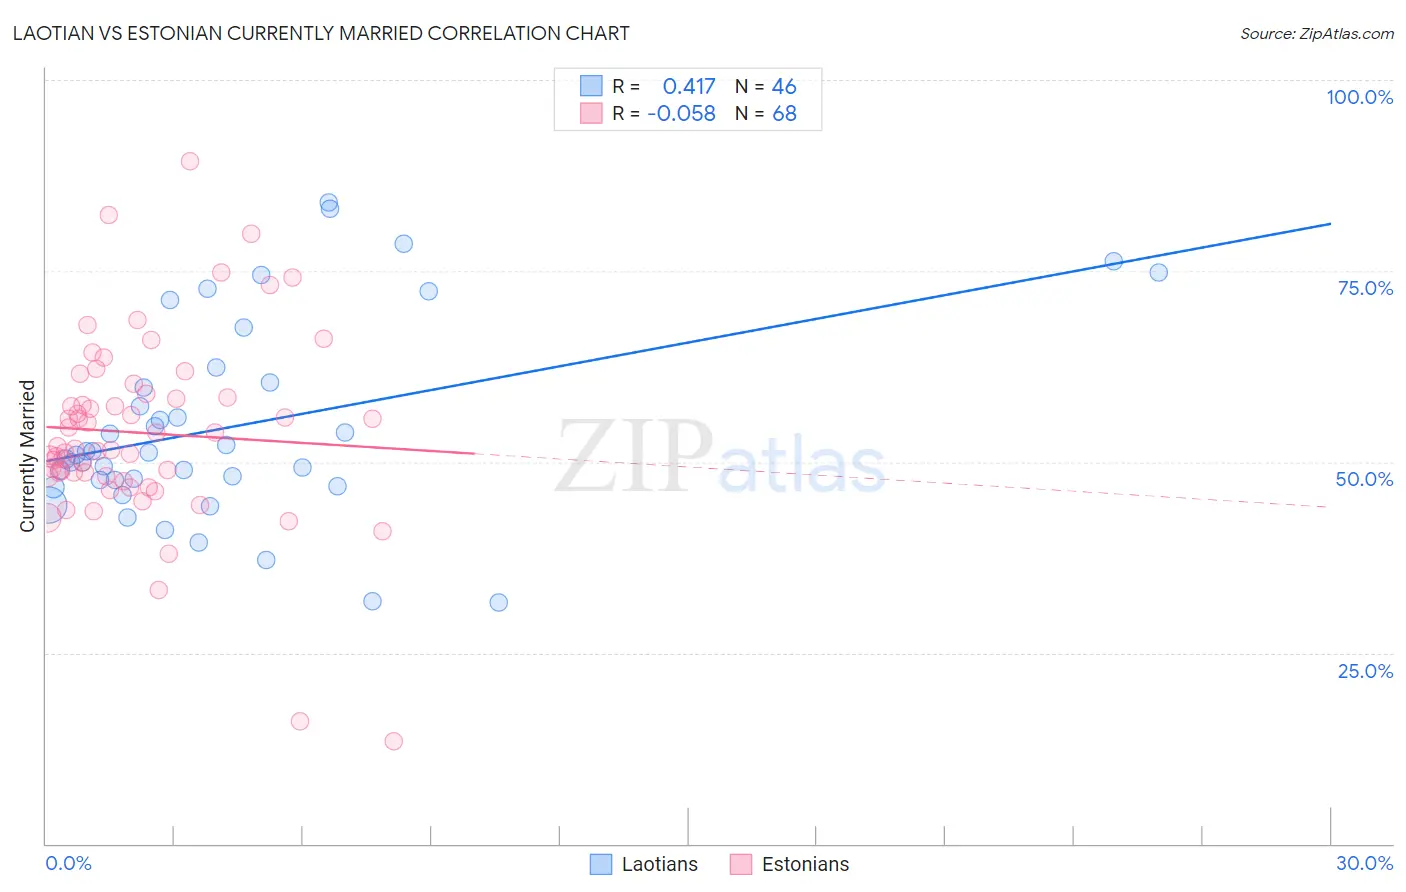
Laotian vs Estonian Currently Married Correlation Chart
The statistical analysis conducted on geographies consisting of 224,816,761 people shows a moderate positive correlation between the proportion of Laotians and percentage of population currently married in the United States with a correlation coefficient (R) of 0.417 and weighted average of 47.4%. Similarly, the statistical analysis conducted on geographies consisting of 123,509,767 people shows a slight negative correlation between the proportion of Estonians and percentage of population currently married in the United States with a correlation coefficient (R) of -0.058 and weighted average of 48.2%, a difference of 1.6%.
Currently Married Correlation Summary
| Measurement | Laotian | Estonian |
| Minimum | 31.6% | 13.5% |
| Maximum | 83.9% | 89.3% |
| Range | 52.3% | 75.8% |
| Mean | 54.7% | 53.8% |
| Median | 51.1% | 51.9% |
| Interquartile 25% (IQ1) | 47.6% | 48.1% |
| Interquartile 75% (IQ3) | 60.4% | 58.7% |
| Interquartile Range (IQR) | 12.7% | 10.6% |
| Standard Deviation (Sample) | 12.9% | 12.4% |
| Standard Deviation (Population) | 12.8% | 12.3% |
Similar Demographics by Currently Married
Demographics Similar to Laotians by Currently Married
In terms of currently married, the demographic groups most similar to Laotians are Immigrants from Kazakhstan (47.4%, a difference of 0.050%), Okinawan (47.4%, a difference of 0.10%), Osage (47.5%, a difference of 0.11%), Immigrants from Jordan (47.4%, a difference of 0.13%), and New Zealander (47.4%, a difference of 0.13%).
| Demographics | Rating | Rank | Currently Married |
| Puget Sound Salish | 90.3 /100 | #117 | Exceptional 47.6% |
| Immigrants | Philippines | 90.2 /100 | #118 | Exceptional 47.6% |
| Australians | 90.2 /100 | #119 | Exceptional 47.6% |
| Syrians | 88.9 /100 | #120 | Excellent 47.5% |
| Immigrants | Croatia | 88.6 /100 | #121 | Excellent 47.5% |
| Osage | 87.9 /100 | #122 | Excellent 47.5% |
| Immigrants | Kazakhstan | 87.2 /100 | #123 | Excellent 47.4% |
| Laotians | 86.6 /100 | #124 | Excellent 47.4% |
| Okinawans | 85.3 /100 | #125 | Excellent 47.4% |
| Immigrants | Jordan | 84.9 /100 | #126 | Excellent 47.4% |
| New Zealanders | 84.9 /100 | #127 | Excellent 47.4% |
| Portuguese | 84.2 /100 | #128 | Excellent 47.3% |
| Sri Lankans | 83.2 /100 | #129 | Excellent 47.3% |
| Immigrants | Iraq | 82.8 /100 | #130 | Excellent 47.3% |
| Icelanders | 82.4 /100 | #131 | Excellent 47.3% |
Demographics Similar to Estonians by Currently Married
In terms of currently married, the demographic groups most similar to Estonians are Immigrants from Eastern Asia (48.2%, a difference of 0.030%), Immigrants from Lebanon (48.2%, a difference of 0.050%), Immigrants from Belarus (48.1%, a difference of 0.070%), Basque (48.1%, a difference of 0.090%), and Slovene (48.1%, a difference of 0.11%).
| Demographics | Rating | Rank | Currently Married |
| Slovaks | 98.2 /100 | #67 | Exceptional 48.3% |
| Immigrants | England | 98.2 /100 | #68 | Exceptional 48.3% |
| Canadians | 98.1 /100 | #69 | Exceptional 48.3% |
| Immigrants | Asia | 97.9 /100 | #70 | Exceptional 48.3% |
| Macedonians | 97.9 /100 | #71 | Exceptional 48.3% |
| Immigrants | Lebanon | 97.6 /100 | #72 | Exceptional 48.2% |
| Immigrants | Eastern Asia | 97.5 /100 | #73 | Exceptional 48.2% |
| Estonians | 97.4 /100 | #74 | Exceptional 48.2% |
| Immigrants | Belarus | 97.2 /100 | #75 | Exceptional 48.1% |
| Basques | 97.2 /100 | #76 | Exceptional 48.1% |
| Slovenes | 97.1 /100 | #77 | Exceptional 48.1% |
| Immigrants | Belgium | 97.1 /100 | #78 | Exceptional 48.1% |
| Immigrants | South Africa | 97.0 /100 | #79 | Exceptional 48.1% |
| Immigrants | Poland | 96.9 /100 | #80 | Exceptional 48.1% |
| Immigrants | Sri Lanka | 96.9 /100 | #81 | Exceptional 48.1% |