Laotian vs French Currently Married

COMPARE

Laotian
Race
Ancestry
AfghanAfricanAlaska NativeAlaskan AthabascanAlbanianAleutAlsatianAmericanApacheArabArapahoArgentineanArmenianAssyrian/Chaldean/SyriacAustralianAustrianBahamianBangladeshiBarbadianBasqueBelgianBelizeanBermudanBhutaneseBlackfeetBolivianBrazilianBritishBritish West IndianBulgarianBurmeseCajunCambodianCanadianCape VerdeanCarpatho RusynCelticCentral AmericanCentral American IndianCherokeeCheyenneChickasawChileanChineseChippewaChoctawColombianColvilleComancheCosta RicanCreeCreekCroatianCrowCubanCypriotCzechCzechoslovakianDanishDelawareDominicanDutchDutch West IndianEastern EuropeanEcuadorianEgyptianEnglishEstonianEthiopianEuropeanFijianFilipinoFinnishFrench American IndianFrench CanadianGermanGerman RussianGhanaianGreekGuamanian/ChamorroGuatemalanGuyaneseHaitianHmongHonduranHopiHoumaHungarianIcelanderIndian (Asian)IndonesianInupiatIranianIraqiIrishIroquoisIsraeliItalianJamaicanJapaneseJordanianKenyanKiowaKoreanLaotianLatvianLebaneseLiberianLithuanianLumbeeLuxembourgerMacedonianMalaysianMalteseMarshalleseMenomineeMexicanMexican American IndianMongolianMoroccanNative HawaiianNavajoNepaleseNew ZealanderNicaraguanNigerianNorthern EuropeanNorwegianOkinawanOsageOttawaPaiutePakistaniPalestinianPanamanianParaguayanPennsylvania GermanPeruvianPimaPolishPortuguesePotawatomiPuebloPuerto RicanPuget Sound SalishRomanianRussianSalvadoranSamoanScandinavianScotch-IrishScottishSeminoleSenegaleseSerbianShoshoneSierra LeoneanSiouxSlavicSlovakSloveneSomaliSouth AfricanSouth AmericanSouth American IndianSoviet UnionSpaniardSpanishSpanish AmericanSpanish American IndianSri LankanSubsaharan AfricanSudaneseSwedishSwissSyrianTaiwaneseThaiTlingit-HaidaTohono O'OdhamTonganTrinidadian and TobagonianTsimshianTurkishU.S. Virgin IslanderUgandanUkrainianUruguayanUteVenezuelanVietnameseWelshWest IndianYakamaYaquiYugoslavianYumanYup'ikZimbabwean
Immigration
NonimmigrantsImmigrantsAfghanistanAfricaAlbaniaArgentinaArmeniaAsiaAustraliaAustriaBahamasBangladeshBarbadosBelarusBelgiumBelizeBoliviaBosnia and HerzegovinaBrazilBulgariaBurma/MyanmarCabo VerdeCambodiaCameroonCanadaCaribbeanCentral AmericaChileChinaColombiaCongoCosta RicaCroatiaCubaCzechoslovakiaDenmarkDominicaDominican RepublicEastern AfricaEastern AsiaEastern EuropeEcuadorEgyptEl SalvadorEnglandEritreaEthiopiaEuropeFijiFranceGermanyGhanaGreeceGrenadaGuatemalaGuyanaHaitiHondurasHong KongHungaryIndiaIndonesiaIranIraqIrelandIsraelItalyJamaicaJapanJordanKazakhstanKenyaKoreaKuwaitLaosLatin AmericaLatviaLebanonLiberiaLithuaniaMalaysiaMexicoMicronesiaMiddle AfricaMoldovaMoroccoNepalNetherlandsNicaraguaNigeriaNorth AmericaNorth MacedoniaNorthern AfricaNorthern EuropeNorwayOceaniaPakistanPanamaPeruPhilippinesPolandPortugalRomaniaRussiaSaudi ArabiaScotlandSenegalSerbiaSierra LeoneSingaporeSomaliaSouth AfricaSouth AmericaSouth Central AsiaSouth Eastern AsiaSouthern EuropeSpainSri LankaSt. Vincent and the GrenadinesSudanSwedenSwitzerlandSyriaTaiwanThailandTrinidad and TobagoTurkeyUgandaUkraineUruguayUzbekistanVenezuelaVietnamWest IndiesWestern AfricaWestern AsiaWestern EuropeYemenZaireZimbabweAzores
French
Race
Ancestry
AfghanAfricanAlaska NativeAlaskan AthabascanAlbanianAleutAlsatianAmericanApacheArabArapahoArgentineanArmenianAssyrian/Chaldean/SyriacAustralianAustrianBahamianBangladeshiBarbadianBasqueBelgianBelizeanBermudanBhutaneseBlackfeetBolivianBrazilianBritishBritish West IndianBulgarianBurmeseCajunCambodianCanadianCape VerdeanCarpatho RusynCelticCentral AmericanCentral American IndianCherokeeCheyenneChickasawChileanChineseChippewaChoctawColombianColvilleComancheCosta RicanCreeCreekCroatianCrowCubanCypriotCzechCzechoslovakianDanishDelawareDominicanDutchDutch West IndianEastern EuropeanEcuadorianEgyptianEnglishEstonianEthiopianEuropeanFijianFilipinoFinnishFrenchFrench American IndianFrench CanadianGermanGerman RussianGhanaianGreekGuamanian/ChamorroGuatemalanGuyaneseHaitianHmongHonduranHopiHoumaHungarianIcelanderIndian (Asian)IndonesianInupiatIranianIraqiIrishIroquoisIsraeliItalianJamaicanJapaneseJordanianKenyanKiowaKoreanLatvianLebaneseLiberianLithuanianLumbeeLuxembourgerMacedonianMalaysianMalteseMarshalleseMenomineeMexicanMexican American IndianMongolianMoroccanNative HawaiianNavajoNepaleseNew ZealanderNicaraguanNigerianNorthern EuropeanNorwegianOkinawanOsageOttawaPaiutePakistaniPalestinianPanamanianParaguayanPennsylvania GermanPeruvianPimaPolishPortuguesePotawatomiPuebloPuerto RicanPuget Sound SalishRomanianRussianSalvadoranSamoanScandinavianScotch-IrishScottishSeminoleSenegaleseSerbianShoshoneSierra LeoneanSiouxSlavicSlovakSloveneSomaliSouth AfricanSouth AmericanSouth American IndianSoviet UnionSpaniardSpanishSpanish AmericanSpanish American IndianSri LankanSubsaharan AfricanSudaneseSwedishSwissSyrianTaiwaneseThaiTlingit-HaidaTohono O'OdhamTonganTrinidadian and TobagonianTsimshianTurkishU.S. Virgin IslanderUgandanUkrainianUruguayanUteVenezuelanVietnameseWelshWest IndianYakamaYaquiYugoslavianYumanYup'ikZimbabwean
Immigration
NonimmigrantsImmigrantsAfghanistanAfricaAlbaniaArgentinaArmeniaAsiaAustraliaAustriaBahamasBangladeshBarbadosBelarusBelgiumBelizeBoliviaBosnia and HerzegovinaBrazilBulgariaBurma/MyanmarCabo VerdeCambodiaCameroonCanadaCaribbeanCentral AmericaChileChinaColombiaCongoCosta RicaCroatiaCubaCzechoslovakiaDenmarkDominicaDominican RepublicEastern AfricaEastern AsiaEastern EuropeEcuadorEgyptEl SalvadorEnglandEritreaEthiopiaEuropeFijiFranceGermanyGhanaGreeceGrenadaGuatemalaGuyanaHaitiHondurasHong KongHungaryIndiaIndonesiaIranIraqIrelandIsraelItalyJamaicaJapanJordanKazakhstanKenyaKoreaKuwaitLaosLatin AmericaLatviaLebanonLiberiaLithuaniaMalaysiaMexicoMicronesiaMiddle AfricaMoldovaMoroccoNepalNetherlandsNicaraguaNigeriaNorth AmericaNorth MacedoniaNorthern AfricaNorthern EuropeNorwayOceaniaPakistanPanamaPeruPhilippinesPolandPortugalRomaniaRussiaSaudi ArabiaScotlandSenegalSerbiaSierra LeoneSingaporeSomaliaSouth AfricaSouth AmericaSouth Central AsiaSouth Eastern AsiaSouthern EuropeSpainSri LankaSt. Vincent and the GrenadinesSudanSwedenSwitzerlandSyriaTaiwanThailandTrinidad and TobagoTurkeyUgandaUkraineUruguayUzbekistanVenezuelaVietnamWest IndiesWestern AfricaWestern AsiaWestern EuropeYemenZaireZimbabweAzores
Currently Married
Income
Poverty
Unemployment
Labor Participation
Family Structure
Vehicle Availability
Education Level
Disability

Currently Married Comparison

Laotians

French

Excellent
Exceptional
47.4%
CURRENTLY MARRIED
86.6/ 100
METRIC RATING
124th/ 347
METRIC RANK
48.4%
CURRENTLY MARRIED
98.6/ 100
METRIC RATING
58th/ 347
METRIC RANK

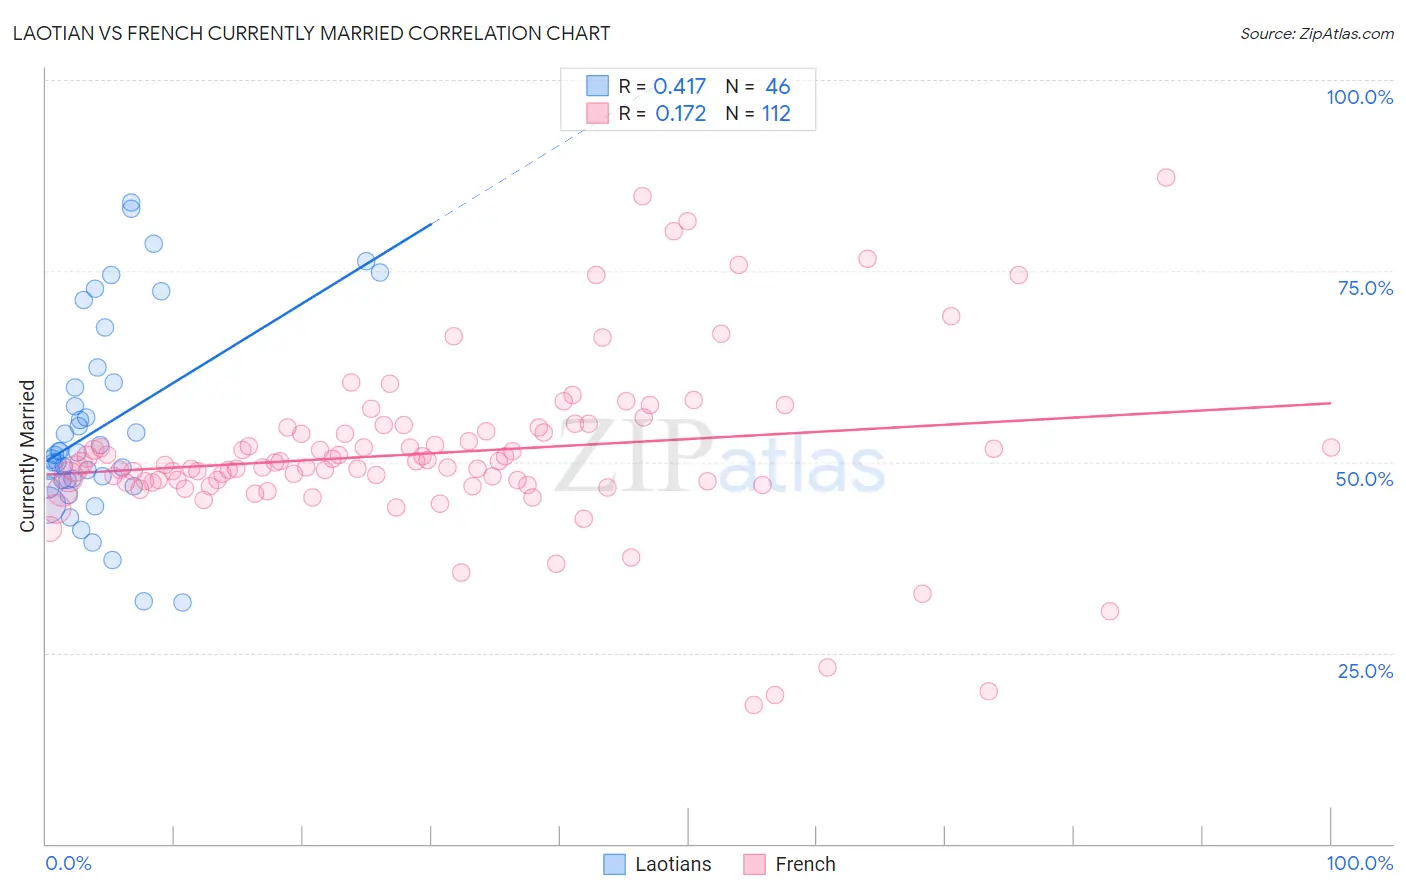
Laotian vs French Currently Married Correlation Chart

The statistical analysis conducted on geographies consisting of 224,816,761 people shows a moderate positive correlation between the proportion of Laotians and percentage of population currently married in the United States with a correlation coefficient (R) of 0.417 and weighted average of 47.4%. Similarly, the statistical analysis conducted on geographies consisting of 572,298,467 people shows a poor positive correlation between the proportion of French and percentage of population currently married in the United States with a correlation coefficient (R) of 0.172 and weighted average of 48.4%, a difference of 2.1%.
Laotian vs French Currently Married

Currently Married Correlation Summary

MeasurementLaotianFrench
Minimum31.6%18.1%
Maximum83.9%87.2%
Range52.3%69.1%
Mean54.7%51.2%
Median51.1%49.6%
Interquartile 25% (IQ1)47.6%47.3%
Interquartile 75% (IQ3)60.4%54.2%
Interquartile Range (IQR)12.7%6.9%
Standard Deviation (Sample)12.9%11.4%
Standard Deviation (Population)12.8%11.3%

Similar Demographics by Currently Married

Demographics Similar to Laotians by Currently Married

In terms of currently married, the demographic groups most similar to Laotians are Immigrants from Kazakhstan (47.4%, a difference of 0.050%), Okinawan (47.4%, a difference of 0.10%), Osage (47.5%, a difference of 0.11%), Immigrants from Jordan (47.4%, a difference of 0.13%), and New Zealander (47.4%, a difference of 0.13%).
DemographicsRating | RankCurrently Married
Puget Sound Salish
90.3
/100
|
#117
Exceptional
47.6%
Immigrants | Philippines
90.2
/100
|
#118
Exceptional
47.6%
Australians
90.2
/100
|
#119
Exceptional
47.6%
Syrians
88.9
/100
|
#120
Excellent
47.5%
Immigrants | Croatia
88.6
/100
|
#121
Excellent
47.5%
Osage
87.9
/100
|
#122
Excellent
47.5%
Immigrants | Kazakhstan
87.2
/100
|
#123
Excellent
47.4%
Laotians
86.6
/100
|
#124
Excellent
47.4%
Okinawans
85.3
/100
|
#125
Excellent
47.4%
Immigrants | Jordan
84.9
/100
|
#126
Excellent
47.4%
New Zealanders
84.9
/100
|
#127
Excellent
47.4%
Portuguese
84.2
/100
|
#128
Excellent
47.3%
Sri Lankans
83.2
/100
|
#129
Excellent
47.3%
Immigrants | Iraq
82.8
/100
|
#130
Excellent
47.3%
Icelanders
82.4
/100
|
#131
Excellent
47.3%

Demographics Similar to French by Currently Married

In terms of currently married, the demographic groups most similar to French are Immigrants from Ireland (48.4%, a difference of 0.030%), Immigrants from Netherlands (48.5%, a difference of 0.040%), Immigrants from Romania (48.4%, a difference of 0.040%), Romanian (48.4%, a difference of 0.050%), and Asian (48.4%, a difference of 0.060%).
DemographicsRating | RankCurrently Married
Whites/Caucasians
99.0
/100
|
#51
Exceptional
48.6%
Russians
98.9
/100
|
#52
Exceptional
48.6%
Immigrants | Austria
98.8
/100
|
#53
Exceptional
48.5%
Immigrants | Moldova
98.7
/100
|
#54
Exceptional
48.5%
Immigrants | North Macedonia
98.7
/100
|
#55
Exceptional
48.5%
Latvians
98.7
/100
|
#56
Exceptional
48.5%
Immigrants | Netherlands
98.6
/100
|
#57
Exceptional
48.5%
French
98.6
/100
|
#58
Exceptional
48.4%
Immigrants | Ireland
98.5
/100
|
#59
Exceptional
48.4%
Immigrants | Romania
98.5
/100
|
#60
Exceptional
48.4%
Romanians
98.5
/100
|
#61
Exceptional
48.4%
Asians
98.5
/100
|
#62
Exceptional
48.4%
Slavs
98.3
/100
|
#63
Exceptional
48.4%
Immigrants | Czechoslovakia
98.3
/100
|
#64
Exceptional
48.4%
Ukrainians
98.3
/100
|
#65
Exceptional
48.4%