Laotian vs Immigrants from Armenia Currently Married
COMPARE
Laotian
Immigrants from Armenia
Currently Married
Currently Married Comparison
Laotians
Immigrants from Armenia
47.4%
CURRENTLY MARRIED
86.6/ 100
METRIC RATING
124th/ 347
METRIC RANK
44.3%
CURRENTLY MARRIED
0.4/ 100
METRIC RATING
245th/ 347
METRIC RANK
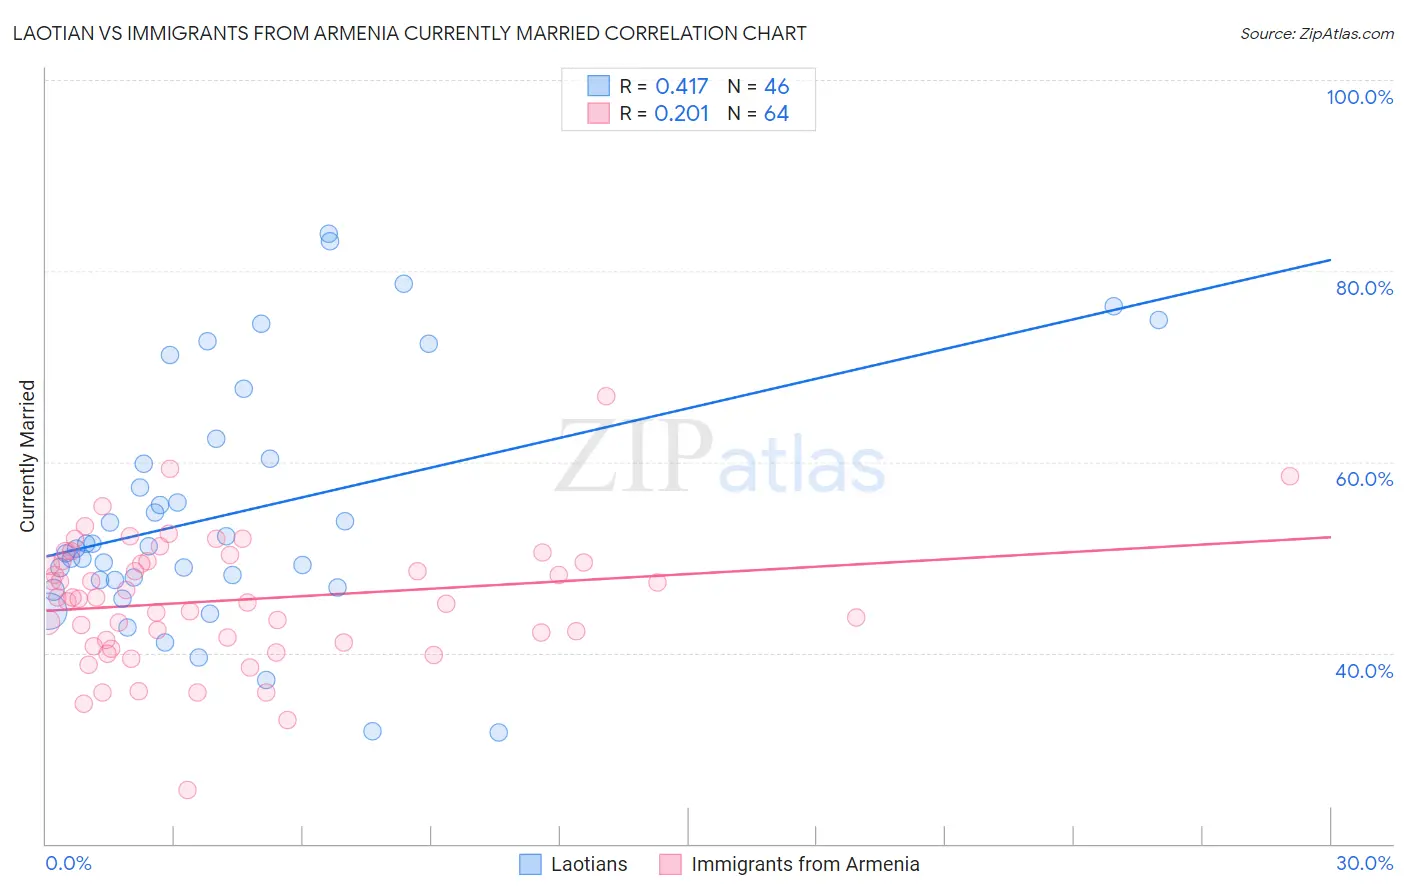
Laotian vs Immigrants from Armenia Currently Married Correlation Chart
The statistical analysis conducted on geographies consisting of 224,816,761 people shows a moderate positive correlation between the proportion of Laotians and percentage of population currently married in the United States with a correlation coefficient (R) of 0.417 and weighted average of 47.4%. Similarly, the statistical analysis conducted on geographies consisting of 97,725,276 people shows a weak positive correlation between the proportion of Immigrants from Armenia and percentage of population currently married in the United States with a correlation coefficient (R) of 0.201 and weighted average of 44.3%, a difference of 7.0%.
Currently Married Correlation Summary
| Measurement | Laotian | Immigrants from Armenia |
| Minimum | 31.6% | 25.6% |
| Maximum | 83.9% | 66.9% |
| Range | 52.3% | 41.3% |
| Mean | 54.7% | 45.5% |
| Median | 51.1% | 45.7% |
| Interquartile 25% (IQ1) | 47.6% | 41.2% |
| Interquartile 75% (IQ3) | 60.4% | 49.6% |
| Interquartile Range (IQR) | 12.7% | 8.3% |
| Standard Deviation (Sample) | 12.9% | 6.8% |
| Standard Deviation (Population) | 12.8% | 6.7% |
Similar Demographics by Currently Married
Demographics Similar to Laotians by Currently Married
In terms of currently married, the demographic groups most similar to Laotians are Immigrants from Kazakhstan (47.4%, a difference of 0.050%), Okinawan (47.4%, a difference of 0.10%), Osage (47.5%, a difference of 0.11%), Immigrants from Jordan (47.4%, a difference of 0.13%), and New Zealander (47.4%, a difference of 0.13%).
| Demographics | Rating | Rank | Currently Married |
| Puget Sound Salish | 90.3 /100 | #117 | Exceptional 47.6% |
| Immigrants | Philippines | 90.2 /100 | #118 | Exceptional 47.6% |
| Australians | 90.2 /100 | #119 | Exceptional 47.6% |
| Syrians | 88.9 /100 | #120 | Excellent 47.5% |
| Immigrants | Croatia | 88.6 /100 | #121 | Excellent 47.5% |
| Osage | 87.9 /100 | #122 | Excellent 47.5% |
| Immigrants | Kazakhstan | 87.2 /100 | #123 | Excellent 47.4% |
| Laotians | 86.6 /100 | #124 | Excellent 47.4% |
| Okinawans | 85.3 /100 | #125 | Excellent 47.4% |
| Immigrants | Jordan | 84.9 /100 | #126 | Excellent 47.4% |
| New Zealanders | 84.9 /100 | #127 | Excellent 47.4% |
| Portuguese | 84.2 /100 | #128 | Excellent 47.3% |
| Sri Lankans | 83.2 /100 | #129 | Excellent 47.3% |
| Immigrants | Iraq | 82.8 /100 | #130 | Excellent 47.3% |
| Icelanders | 82.4 /100 | #131 | Excellent 47.3% |
Demographics Similar to Immigrants from Armenia by Currently Married
In terms of currently married, the demographic groups most similar to Immigrants from Armenia are Immigrants from Burma/Myanmar (44.3%, a difference of 0.070%), Ugandan (44.2%, a difference of 0.20%), Nicaraguan (44.2%, a difference of 0.29%), Immigrants from Cameroon (44.2%, a difference of 0.30%), and Japanese (44.5%, a difference of 0.31%).
| Demographics | Rating | Rank | Currently Married |
| Moroccans | 0.9 /100 | #238 | Tragic 44.6% |
| Immigrants | Mexico | 0.7 /100 | #239 | Tragic 44.5% |
| Mexican American Indians | 0.7 /100 | #240 | Tragic 44.5% |
| Ethiopians | 0.7 /100 | #241 | Tragic 44.5% |
| Immigrants | Cambodia | 0.7 /100 | #242 | Tragic 44.5% |
| Immigrants | Ethiopia | 0.7 /100 | #243 | Tragic 44.5% |
| Japanese | 0.6 /100 | #244 | Tragic 44.5% |
| Immigrants | Armenia | 0.4 /100 | #245 | Tragic 44.3% |
| Immigrants | Burma/Myanmar | 0.4 /100 | #246 | Tragic 44.3% |
| Ugandans | 0.4 /100 | #247 | Tragic 44.2% |
| Nicaraguans | 0.3 /100 | #248 | Tragic 44.2% |
| Immigrants | Cameroon | 0.3 /100 | #249 | Tragic 44.2% |
| Immigrants | Eastern Africa | 0.3 /100 | #250 | Tragic 44.2% |
| Blackfeet | 0.3 /100 | #251 | Tragic 44.2% |
| Hispanics or Latinos | 0.3 /100 | #252 | Tragic 44.1% |